Mozilla Reps Community: Reps of the Month – September 2019 |
Please join us in congratulating our Reps of the Month for September 2019, Jyotsna Gupta and David Gonzalez Blanchard
Jyotsna is a Mozilla Rep and a Tech Speaker from Bangalore, India. The majority of her contributions goes to Add-ons, from building PrivateX to being an Add-ons Content Reviewer and a judge in the Firefox Quantum Extensions Challenge. She was also highlighted as a Friend of Add-ons in the last quarter of 2018 on the Add-ons blog. Besides all this, she mentored new extension developers in her local community and joined the Featured Extensions Advisory Board.

More recently she joined the Mozilla Tech Speakers Program through which she frequently speaks about cross-browser extension development at various events and conferences. She aims to hone her public and tech speaking skills to help and collaborate with open source developers and communities.
David has been a member of the Nicaraguan Mozilla Community since 2010 and a Mozilla Rep since 2011, the year in which the community began to participate and share knowledge related to the web and Mozilla. Since then he has supported different activities to promote openness on the web and everything related to the community both in Nicaragua and the rest of Central American countries.

He has collaborated giving talks, workshops, organizing activities with the aim of unifying the communities of Mozilla Central America. He is currently promoting the development of video games, virtual reality with WebVR, Rust, and Common Voice. His main interest is to share knowledge about software development and promote a web accessible to all. The most recent activity he participated in was Mozilla Activate 2019 in Nicaragua where they talked about different topics related to Mozilla Activate and about innovation on the web.
Congratulations and keep rocking the open web!
https://blog.mozilla.org/mozillareps/2019/10/17/reps-of-the-month-september-2019/
|
|
The Firefox Frontier: Get recommended reading from Pocket every time you open a new tab in Firefox |
Thousands of articles are published each day, all fighting for our attention. But how many are actually worth reading? The tiniest fraction, and they’re tough to find. That’s where Pocket … Read more
The post Get recommended reading from Pocket every time you open a new tab in Firefox appeared first on The Firefox Frontier.
|
|
Hacks.Mozilla.Org: Developing cross-browser extensions with web-ext 3.2.0 |
The web-ext tool was created at Mozilla to help you build browser extensions faster and more easily. Although our first launch focused on support for desktop Firefox, followed by Firefox for Android, our vision was always to support cross-browser development once we shipped Firefox support.
With the 3.2.0 release, you can use web-ext to truly build cross-browser extensions! Here is an example of developing an extension in Google Chrome using the run command:
$ web-ext run -t chromiumWhat’s even better is you can run your extension in both Firefox and Chrome at the same time:
$ web-ext run -t firefox-desktop -t chromiumAs you’d expect, you can develop in any other Chromium-based browser such as Brave, Microsoft Edge, Opera or Vivaldi. Here’s an example of developing in Opera:
$ web-ext run -t chromium --chromium-binary /usr/bin/operaFirefox’s WebExtensions API has always strived for Chrome API compatibility but several improvements have resulted in subtle differences, like how WebExtensions APIs always return promises. Mozilla already offers the webextensions-polyfill library to normalize promises and other things across both browser platforms.
And now, we are excited to offer a robust development solution for cross-browser extensions! Once you give it a try, let us know if you run into issues or have ideas for improvement.
Here is an example of launching an extension in Firefox and Chrome then editing a CSS file in the extension source to show off the automatic reloading feature.
web-ext 3.2.0Chromium browser support isn’t the only nice new feature. Thanks to parse-json 5.0.0, the parsing errors on the extension manifest and locale files will now include a code frame. This will make it a lot easier to track down and fix mistakes.

The post Developing cross-browser extensions with web-ext 3.2.0 appeared first on Mozilla Hacks - the Web developer blog.
https://hacks.mozilla.org/2019/10/developing-cross-browser-extensions-with-web-ext-3-2-0/
|
|
Mozilla Security Blog: Improved Security and Privacy Indicators in Firefox 70 |
The upcoming Firefox 70 release will update the security and privacy indicators in the URL bar.
In recent years we have seen a great increase in the number of websites that are delivered securely via HTTPS. At the same time, privacy threats have become more prevalent on the web and Firefox has shipped new technologies to protect our users against tracking.
To better reflect this new environment, the updated UI takes a step towards treating secure HTTPS as the default method of transport for websites, instead of a way to identify website security. It also puts greater emphasis on user privacy.
This post will outline the major changes to our primary security indicators:
Firefox traditionally marked sites delivered via a secure transport mechanism with a green lock icon. Sites delivered via insecure mechanisms got no additional security indicators. All sites were marked with an “information” icon, which served as an access point for more site information.
![]()
As part of the changes in Firefox 70, we will start showing a crossed-out lock icon as permanent indicator for sites delivered via the insecure protocols HTTP and FTP. Over two years ago, we started showing this indicator for insecure login pages. We also announced our intent to expand by showing a negative indicator for all HTTP pages as HTTPS adoption increases. By now, Firefox loads about 80% of pages via HTTPS.
The formerly green lock icon will now become gray, with the intention of de-emphasizing the default (secure) connection state and instead putting more emphasis on broken or insecure connections.
We will remove the “information” icon. The lock icon will be the new entry point for accessing security and identity information about the website.
A recent study by Thompson et al. shows that the display of the company name and country in the URL bar when the website is using an Extended Validation TLS certificate does not add any additional security parameters. One of the biggest downsides with this approach is that it requires the user to notice the absence of the EV indicator on a malicious site. Furthermore, it has been demonstrated that EV certificates with colliding entity names can be generated by choosing a different jurisdiction.
As a result, we will relocate the EV indicator to the “Site Information” panel that is accessed by clicking on the lock icon. This change will hide the indicator from the majority of our users while keeping it accessible for those who need to access it. It also avoids ambiguities that could previously arise when the entity name in the URL bar was cut off to make space for the URL.

The protections icon will be the entry point for the privacy properties of every page. It lets the user know about trackers or cryptominers on the page and how Firefox restricts them to improve privacy and performance. The icon will have 3 different states.

Protections Enabled
When no tracking activity is detected and protections are not necessary, the shield shows in grey.
Protections Active
When protections are active on the current page, the shield displays a very subtle animation and adopt the purple gradient.
Protections Disabled
When the user has disabled protections for the site, the shield shows with a strike-through.
We are excited to roll out this improved new UI and will continue to evolve the indicators to give Firefox users an easy way to assess their privacy and security anywhere on the modern web.
A big thank you to all the individuals that contributed to this effort.
The post Improved Security and Privacy Indicators in Firefox 70 appeared first on Mozilla Security Blog.
https://blog.mozilla.org/security/2019/10/15/improved-security-and-privacy-indicators-in-firefox-70/
|
|
Mozilla Addons Blog: Search Engine add-ons to be removed from addons.mozilla.org |
For the last eleven years, Firefox Search Engine add-ons have been powered by OpenSearch. With the recent implementation of the search overrides API, a WebExtensions API that offers users more controls for opting into changes, Mozilla intends to deprecate OpenSearch and eventually remove it from Firefox. Search Engine add-ons will be removed from AMO on December 5, 2019.
For Search Engine add-ons to continue working, they must be converted to an extension using the WebExtensions API by December 3, 2019. For more information, please see the following documents on MDN web docs:
Unfortunately, it is not possible to automatically migrate users of Search Engine add-ons to their replacement extensions. If you are the developer of a Search Engine add-on, we recommend linking to your new extension’s listing page from your search add-on’s listing page so your users know where to install the update.
If you have any questions, please ask them in our community forum.
The post Search Engine add-ons to be removed from addons.mozilla.org appeared first on Mozilla Add-ons Blog.
|
|
The Firefox Frontier: Why you should review your credit report after a data breach |
When significant data breaches happen where high risk data is at stake, there’s often a lot of talk about credit reports. Some companies that have been hacked may even be … Read more
The post Why you should review your credit report after a data breach appeared first on The Firefox Frontier.
https://blog.mozilla.org/firefox/check-credit-report-after-a-data-breach/
|
|
Hacks.Mozilla.Org: Firefox’s New WebSocket Inspector |
The Firefox DevTools team and our contributors were hard at work over the summer, getting Firefox 70 jam-packed with improvements. We are especially excited about our new WebSocket inspection feature, because you told us in feedback how important it would be for your daily work. The WebSocket inspector will be released in Firefox 71, but is ready for you to use in Firefox Developer Edition now.
To use the inspector now, download Firefox Developer Edition, open DevTools’ Network panel to find the Messages tab. Then, keep reading to learn more about WebSockets and the tricks that the new panel has up its sleeve.
But first, big thanks to Heng Yeow Tan, the Google Summer of Code (GSoC) student who’s responsible for the implementation.
We use the WebSocket (WS) API to create a persistent connection between a client and server. Because the API sends and receives data at any time, it is used mainly in applications requiring real-time communication.
Although it is possible to work directly with the WS API, some existing libraries come in handy and help save time. These libraries can help with connection failures, proxies, authentication and authorization, scalability, and much more. The WS inspector in Firefox DevTools currently supports Socket.IO and SockJS, but more support is in the works.
Want to learn more about how to set up WebSocket for your client applications? Head over to MDN’s guides. In the meantime, let’s dive into the new feature.
The WebSocket Inspector is part of the existing Network panel UI in DevTools. It’s already possible to filter the content for opened WS connections in this panel, but till now there was no chance to see the actual data transferred through WS frames.
The following screenshot shows the WS filter in action. Only the 101 request (WebSocket Protocol Handshake) is visible. The response code indicates that the server is switching to WS connection.

Clicking on the 101 request opens the familiar sidebar, showing details about the selected HTTP request. In addition, the UI now offers a fresh new Messages panel that can be used to inspect WS frames sent and received through the selected WS connection.

The live-updated table shows data for sent (green arrow) and received (red arrow) WS frames. Each frame expands on click, so you can inspect the formatted data.
To focus on specific messages, frames can be filtered free text.

The Data and Time columns are visible by default, but you can customize the interface to see more columns by right-clicking on the header.

Selecting a frame in the list shows a preview at the bottom of the Messages panel.

The inspector currently supports the following WS protocols – and we have more planned:
Payload based on those protocols is parsed and displayed as an expandable tree for easy inspection. Of course, you can still see the raw data (as sent over the wire) as well.

Use the pause/resume button in the Network panel toolbar to stop intercepting WS traffic. This allows you to capture only the frames that you are interested in.

We wanted to release this initial feature set quickly to let you use it. We have a few things that we are still working on for upcoming releases:
We would love your feedback on the new WebSocket Inspector, which is available now in Firefox Developer Edition 70. It will be released in Firefox 71, to include some of your feedback and bugfixes. If you haven’t had a chance yet, install and open Developer Edition, then follow along with this post to master WebSocket debugging.
The post Firefox’s New WebSocket Inspector appeared first on Mozilla Hacks - the Web developer blog.
https://hacks.mozilla.org/2019/10/firefoxs-new-websocket-inspector/
|
|
Daniel Stenberg: Me, curl and Dagens Nyheter |
In the afternoon of October 1st 2019, I had the pleasure of welcoming Linus Larsson and Jonas Lindkvist into my home in Huddinge, south of Stockholm, Sweden. My home is also my office as I work full-time from home. These two fine gentlemen work for Sweden’s largest morning newspaper, Dagens Nyheter, which boasts 850,000 daily readers.
Jonas took what felt like a hundred photos of me, most of them when I sit in my office chair at my regular desk where my primary development computers and environment are. As you can see in the two photos on this blog post. I will admit that I did minimize most of my regular Windows from the screens to that I wouldn’t accidentally reveal something personal or sensitive, but on the plus side is that if you pay close attention you can see my Simon Stalenhag desktop backgrounds better!
Me and Linus then sat down and talked. We talked about my background, how curl was created and how it has “taken off” to an extent I of course could never even dream about. Today, I estimate that curl runs in perhaps ten billion installations. A truly mind boggling – and humbling – number.

The interview/chat lasted for about an hour or so. I figured we had touched most relevant areas and Linus seemed content with the material and input he’d gotten from me. As this topic and article wasn’t really time sensitive or something that would have to be timed with something particular Linus explained that he didn’t know exactly when it would get published and it didn’t bother me. I figured it would be cool whenever!

On the morning of October 14 I collected the paper from my mailbox (because yes, I still do have a paper version newspaper arriving at my home every morning) and boom, I spotted an interesting little note in the lower right hand corner.
You can see the (Swedish-speaking) front-page blurb on the photo on the right.
V"arldens st"orsta programmerare du aldrig h"ort talas om (links to the dn.se site for the Swedish article, possibly behind a paywall)
The interesting timing this morning made it out so that this was the same morning I delivered a keynote at Castor Software Days at KTH in Stockholm titled “curl, a hobby project that conquered the world” (slides) – which by the way was received very well and I got a lot of positive comments and interesting conversations afterwards. And lots of people of course noticed the interestingly timed coincidence with the DN article!

The DN article reaches out to “ordinary” people in ways I’m not used to, so of course this made more of my non-techie friends suddenly realize a little more of what I do. I think it captures my “journey” and my approach to life and curl fairly well.
I’ll probably extend this blog post with links/photos of the actual DN articles at a later point once I feel I don’t risk undermining DN’s business by doing so.
(photos by Jonas Lindkvist, Dagens Nyheter, used in the online article about me)
https://daniel.haxx.se/blog/2019/10/15/me-curl-and-dagens-nyheter/
|
|
Anne van Kesteren: Heading levels |
The HTML Standard contains an algorithm to compute heading levels and has for the past fifteen years or so, that’s fairly complex and not implemented anywhere. E.g., for the following fragment
 Apples
 Apples are fruit.


   Taste
   They taste lovely.

  Sweet
  Red apples are sweeter than green ones.
  Color
  Apples come in various colors.
the headings would be “Apples” (level 1), “Taste” (level 2), “Sweet” (level 3), “Color” (level 2). Determining the level of any given heading requires traversing through its previous siblings and their descendants, its parent and the previous siblings and descendants of that, et cetera. That is too much complexity and optimizing it with caches is evidently not deemed worth it for such a simple feature.
However, throwing out the entire feature and requiring everyone to use h1 through h6 forever, adjusting them accordingly based on the document they end up in, is not very appealing to me. So I’ve been trying to come up with an alternative algorithm that would allow folks to use h1 with sectioning elements exclusively while giving assistive technology the right information (default styling of h1 is already adjusted based on nesting depth).
The simpler algorithm only looks at ancestors for a given heading and effectively only does so for h1 (unless you use hgroup). This leaves the above example in the weird state it is in in today’s browsers, except that the h1 (“Color”) would become level 2. It does so to minimally impact existing documents which would usually use h1 only as a top-level element or per the somewhat-erroneous recommendation of the HTML Standard use it everywhere, but in that case it would dramatically improve the outcome.
I’m hopeful we can have a prototype of this in Firefox soon and eventually supplement it with a :heading/:heading(…) pseudo-class to provide additional benefits to folks to level headings correctly. Standards-wise much of this is being sorted in whatwg/html #3499 and various issues linked from there.
|
|
Karl Dubost: This is not a remote work |
Everyone these days is working remotely in some ways. What people assume (both companies and employees) is that remote working is about working at distance from the office, and most of the time, from home. The notion of location here is a very important trope carried by the word "remote".
There is an assumption from corporations that time on site is equivalent to one of these:
As a note for managers, it makes me grin when a company is able to hire another company for a service or a specific deliverables without control on daily hours, locations, etc. but freak out when discussing with its own employees cohort about relaxing the constraints of the office location.
So let's create a term for it. I prefer "alocalized" instead of remote. Remote too often induces the meaning of a central location, where some of the employees are working as satellites. Not all profession can be alocalized. Some jobs require someone to be physically on-site to be able to act on the task (in-house offices cleaners, receptionists, assembly line workers). Some jobs are done outside of the central location by their nature themselves (carpenters, high power lines workers). It's not usually the type of works we consider when we mention this topic.
Everyone who can execute their task in a distributed fashion, still cooperating with each other to be able to advance the work is a possible candidate for alocalized work.
If you are an employer, stop worrying about the abilities of your employees to work in an alocalized fashion. Before you need to assess if the company is able to work that way. Here some criteria that will make the environment friendly for workers.
Management must be part of it. Everyone should be included in the new way of working. The location is not important. Work in or outside of an office should not matter. That's critical.
There are issues, where this way of working will fail. But not necessary, the way most employers think about it.
Many of the issues for people working alocalized are often created by the work organization in the company itself.
On the personal level, the employees should assess their ability to work outside of an office. It's unrelated to the skills level. Some employees with 20 years of work experience will always be unable to work outside of an office. See below.
I have started working in a distributed environment very early. In 1994, when I was studying for my DEA in Astrophysics and Spatial Techniques, I was also doing my national service (mandatory at the time) at Observatoir de Meudon in France. The work included working with people and data across the world. Probably my first experience of having to deal with alocalized, asynchronous tasks.
But my skills of really working in a distributed environment was when I landed a job at W3C from 2000 to 2008. There is a specific culture at W3C which is first class in terms of working in a distributed fashion. This is essential. I worked both from offices and from home (or cafes or airports). Location didn't matter that much. I had years where I worked only in offices, and years working exclusively not from an office. I insist on saying "not from an office" compared "from home".
Then I worked for Opera Software from 2010 to 2013, again not in an office. And the same for Mozilla from 2013.
W3C is still the place which fares the best in terms of working in a distributed, alocalized fashion. At Mozilla, for example, too many people relies on slack discussions, closed google documents or private email threads for working. This should not happen.
For my work self-organization, things which worked.
Otsukare!
|
|
The Rust Programming Language Blog: Announcing Rustup 1.20.0 |
The rustup working group is happy to announce the release of rustup version 1.20.0. Rustup is the recommended tool to install Rust, a programming language that is empowering everyone to build reliable and efficient software.
If you have a previous version of rustup installed, getting rustup 1.20.0 is as easy as:
rustup self update
Rustup will also automatically update itself at the end of a normal toolchain update:
rustup update
If you don't have it already, you can get rustup from the appropriate page on our website.
The highlights of this release are profiles support, the ability to get the latest available nightly with all the components you need, and improvements to the rustup doc command. You can also check out the changelog for a list of all the changes included in this release.
Previous versions of rustup installed a few components by default along with each toolchain: the compiler (rustc), the package manager (cargo), the standard library (rust-std), and offline documentation (rust-docs). While this approach is fine while developing software locally, some of the components (like rust-docs) slowed down the installation, either because they're not used on build servers, or on Windows due to the large amount of installed files.
To address this problem, rustup 1.20.0 introduces the concept of "profiles". They are groups of components you can choose to download while installing a new Rust toolchain. The profiles available at this time are minimal, default, and complete:
rustc, rust-std, and cargo). It's recommended to use this component on Windows systems if you don't use local documentation, and in CI.rustc, rust-std, cargo, and rust-docs) plus rustfmt and clippy. This profile will be used by rustup by default, and it's the one recommended for general use.miri and IDE integration tools (rls and rust-analysis).To change the rustup profile you can use the rustup set profile command. For example, to select the minimal profile you can use:
rustup set profile minimal
It's also possible to choose the profile when installing rustup for the first time, either interactively by choosing the "Customize installation" option or programmaticaly by passing the --profile= flag. Profiles will only affect newly installed toolchains: as usual it will be possible to install individual components later with: rustup component add.
While most components are guaranteed to be present on stable releases of tier 1 platforms, the same guarantee doesn't apply to nightly builds. Frequently, tools such as rustfmt, clippy, or rls are missing in the latest nightly. If you depend on these tools, that makes updating nighties hard, as rustup will prevent the upgrade if a component you previously installed is missing.
Starting from rustup 1.20.0, if a component you previously installed is missing in the latest nightly, rustup update will walk backwards in time to find the most recent release with all the components you need. If there are no new nightlies with all the components you need you'll either need to wait or remove some of them.
Along with this change, rustup 1.20.0 introduces the --component/-c and --target/-t options to the rustup toolchain install command, allowing you to add components and targets as the toolchain is installed. These flags will also search past nightlies if the current one does not feature all the requested components.
rustup docThe rustup doc command opens the locally installed documentation on your browser, without any Internet connection required. rustup 1.20.0 enhances the command allowing you to open directly the API documentation of a specific item. For example to look at the documentation of Iterator you can use:
rustup doc std::iter::Iterator
This works for traits, structs/enums, macros, and modules, and can take you to the std, alloc, and core crates. Note, however, that this functionality will only work if you have the rust-docs component installed in your toolchain. We will be improving the command's UX over time, so if you have ideas, please do let us know!
Thanks to all the contributors who made rustup 1.20.0 possible!
|
|
Mozilla Security Blog: Hardening Firefox against Injection Attacks |
A proven effective way to counter code injection attacks is to reduce the attack surface by removing potentially dangerous artifacts in the codebase and hence hardening the code at various levels. To make Firefox resilient against such code injection attacks, we removed occurrences of inline scripts as well as removed eval()-like functions.
Firefox not only renders web pages on the internet but also ships with a variety of built-in pages, commonly referred to as about:pages. Such about: pages provide an interface to reveal internal state of the browser. Most prominently, about:config, which exposes an API to inspect and update preferences and settings which allows Firefox users to tailor their Firefox instance to their specific needs.
Since such about: pages are also implemented using HTML and JavaScript they are subject to the same security model as regular web pages and therefore not immune against code injection attacks. More figuratively, if an attacker manages to inject code into such an about: page, it potentially allows an attacker to execute the injected script code in the security context of the browser itself, hence allowing the attacker to perform arbitrary actions on the behalf of the user.
To better protect our users and to add an additional layer of security to Firefox, we rewrote all inline event handlers and moved all inline JavaScript code to packaged files for all 45 about: pages. This allowed us to apply a strong Content Security Policy (CSP) such as ‘default-src chrome:’ which ensures that injected JavaScript code does not execute. Instead JavaScript code only executes when loaded from a packaged resource using the internal chrome: protocol. Not allowing any inline script in any of the about: pages limits the attack surface of arbitrary code execution and hence provides a strong first line of defense against code injection attacks.
The JavaScript function eval(), along with the similar ‘new Function’ and ‘setTimeout()/setInterval()’, is a powerful yet dangerous tool. It parses and executes an arbitrary string in the same security context as itself. This execution scheme conveniently allows executing code generated at runtime or stored in non-script locations like the Document-Object Model (DOM). The downside however is that ‘eval()’ introduces significant attack surface for code injection and we discourage its use in favour of safer alternatives.
To further minimize the attack surface in Firefox and discourage the use of eval() we rewrote all use of ‘eval()’-like functions from system privileged contexts and from the parent process in the Firefox codebase. Additionally we added assertions, disallowing the use of ‘eval()’ and its relatives in system-privileged script contexts.
Unexpectedly, in our effort to monitor and remove all eval()-like functions we also encountered calls to eval() outside of our codebase. For some background, a long time ago, Firefox supported a mechanism which allowed you to execute user-supplied JavaScript in the execution context of the browser. Back then this feature, now considered a security risk, allowed you to customize Firefox at start up time and was called userChrome.js. After that mechanism was removed, users found a way to accomplish the same thing through a few other unintended tricks. Unfortunately we have no control of what users put in these customization files, but our runtime checks confirmed that in a few rare cases it included eval. When we detect that the user has enabled such tricks, we will disable our blocking mechanism and allow usage of eval().
Going forward, our introduced eval() assertions will continue to inform the Mozilla Security Team of yet unknown instances of eval() which we will closely audit and evaluate and restrict as we further harden the Firefox Security Landscape.
For the Mozilla Security Team,
Vinothkumar Nagasayanan, Jonas Allmann, Tom Ritter, and Christoph Kerschbaumer
The post Hardening Firefox against Injection Attacks appeared first on Mozilla Security Blog.
https://blog.mozilla.org/security/2019/10/14/hardening-firefox-against-injection-attacks/
|
|
Cameron Kaiser: Chrome users gloriously freed from obviously treacherous and unsafe uBlock Origin |
Really, this is an incredible own goal on Google's part. Although I won't resist the opportunity to rag on them, I also grudgingly admit that this is probably incompetence rather than malice and likely yet another instance of something falling through the cracks in Google's all-powerful, rarely examined automatic algorithms (though there is circumstantial evidence to the contrary). Having a human examine these choices costs money in engineering time, and frankly when the automated systems are misjudging something that will probably cost Google's ad business money as well, there's just no incentive to do anything about it. But it's a bad look, especially with how two-faced the policy on Manifest V3 has turned out to be and its effect on ad-blocker options for Chrome.
UPDATE: I hate always being right. Peter Kasting, a big wheel and original member of the Chrome team, escalated the issue and the extension is back, but for how long? And will it happen again? And what if you're not a squeaky enough wheel to gain enough attention to your plight?
It is important to note that this block is for Chrome rather than Chromium-based browsers (like Edge, Opera, Brave, etc.). That said, Chrome is clearly the one-ton gorilla, and Google doesn't like you sideloading extensions either. While Mozilla reviews extensions too, and there have been controversial rejections on their part, speaking as an add-on author of over a decade there is at least a human on the other end even if once in a while the human is a butthead. (A volunteer butthead, to be sure, but still a butthead.) So far I think they've reached a reasonable compromise between safety and user choice even if sometimes the efforts don't scale. On the other hand, Google clearly hasn't by any metric.
This is a good time to remind people who may not know that TenFourFox has built-in basic adblock, targeted at the JavaScript-based nuisances that are most pernicious on our older systems. It's not only an integral part of the browser but it's also actually written in C++, so it's faster than a JavaScript-based add-on and works at a much lower level. It can also be combined with Private Browsing and other adblocker add-ons for even more comprehensive protection.
You may have suspected by the relative lack of activity on this blog and at Github that there aren't going to be any new features in the next TenFourFox release, and you'd be right. Between my wife and I actually being in the same hemisphere for a couple weeks, an incredible amount of work at the dayjob and work on the POWER9 side for mainline Firefox I've just been too short-handed to do much development this cycle. It will instead be numbered FPR16 SPR1 with security patches only and I'll use the opportunity to change our upstream certificate source to 68ESR. Watch for it sometime next week.
http://tenfourfox.blogspot.com/2019/10/chrome-users-gloriously-freed-from.html
|
|
Hacks.Mozilla.Org: The Mozilla Developer Roadshow Talks: Firefox, WebAssembly, CSS, WebXR and More |
The Mozilla Developer Roadshow program launched in 2017. Our mission: Bring expert speakers and technology updates to local communities through free events and partnerships. These interactive meetup-style events help developers find resources and activities relevant to their day-to-day productivity and professional skill development.
The roadshow through Germany and Austria featured four back-to-back evening events from August 26th-29th. In Nuremberg, Munich, Linz, and Vienna, we met over 400 local developers and designers in their hometowns. In fact, at every stop we found strong interest and lively curiosity about the web platform.
For this tour, Mozilla partnered with the beyond tellerrand team, led by Marc Thiele. And today, we’re excited to share the video recordings with you!
Five Mozilla speakers presented in each city; we added guest speakers in Munich and Vienna. First up, Ali Spivak, Mozilla’s Director of Developer Relations, opened each session with an overview of Firefox and highlights from our emerging technology projects.
In addition, each event included our signature networking hour. As always, we encouraged attendees and speakers to bridge the speaking stage gap. In this informal setting, we enjoyed real conversations about the real concerns of people who work on the web. Mozilla TechSpeakers Hui Jing Chen and Fabien Benetou joined the team, along with Mozilla Research Engineer Diane Hosfelt, and Developer Advocate Dan Callahan.
In November, the Mozilla Developer Roadshow tour continues in Asia. Free tickets are now available, so you can register today for one of the following events:
Make sure to secure your spot by registering now!
The post The Mozilla Developer Roadshow Talks: Firefox, WebAssembly, CSS, WebXR and More appeared first on Mozilla Hacks - the Web developer blog.
|
|
Nicholas Nethercote: How to speed up the Rust compiler some more in 2019 |
In July I wrote about my efforts to speed up the Rust compiler in 2019. I also described how the Rust compiler has gotten faster in 2019, with compile time reductions of 20-50% on most benchmarks. Now that Q3 is finished it’s a good time to see how things have changed since then.
The following image shows changes in time taken to compile many of the standard benchmarks used on the Rust performance tracker. It compares a revision of the the compiler from 2019-07-23 with a revision of the compiler from 2019-10-09.
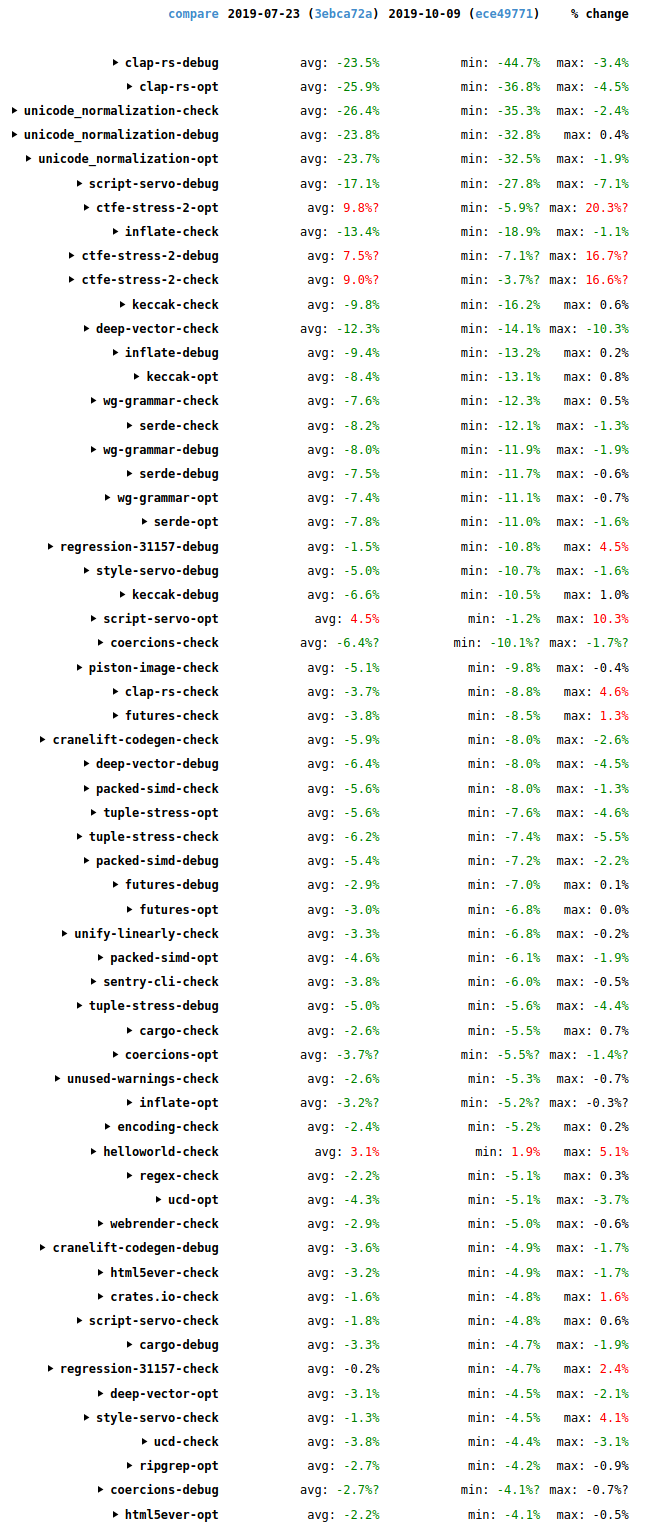
These are the wall-time results. There are three different build kinds measured for each one: a debug build, an optimized build, and a check build (which detects errors but doesn’t generate code). For each build kind there is a mix of incremental and non-incremental runs done. The numbers for the individual runs aren’t shown here but you can see them if you view the results directly on the site and click around. (Note that the site has had some reliability issues lately. Apologies if you have difficulty with that link.) The “avg” column shows the average change for those runs. The “min” and “max” columns show the minimum and maximum changes among those same runs.
There are a few regressions, mostly notably for the ctfe-stress-2 benchmark, which is an artificial stress test of compile-time function evaluation and so isn’t too much of a concern. But there are many more improvements, including double-digit improvements for clap-rs, inflate, unicode_normalization, keccak, wg-grammar, serde, deep-vector, script-servo, and style-servo. There have been many interesting things going on.
For a long time, profilers like Cachegrind and Callgrind have shown that 2-6% of the instructions executed by the Rust compiler occur in calls to memcpy. This seems high! Curious about this, I modified DHAT to track calls to memcpy, much in the way it normally tracks calls to malloc.
The results showed that most of the memcpy calls come from a relatively small number of code locations. Also, all the memcpy calls involved values that exceed 128 bytes. It turns out that LLVM will use inline code for copies of values that are 128 bytes or smaller. (Inline code will generally be faster, but memcpy calls will be more compact above a certain copy size.)
I was able to eliminate some of these memcpy calls in the following PRs.
#64302: This PR shrank the ObligationCauseCode type from 56 bytes to 32 bytes by boxing two of its variants, speeding up many benchmarks by up to 2.6%. The benefit mostly came because the PredicateObligation type (which contains an ObligationCauseCode) shrank from 136 bytes to 112 bytes, which dropped it below the 128 byte memcpy threshold. I also tried reducing the size of ObligationCauseCode to 24 bytes by boxing two additional variants, but this had worse performance because more allocations were required.
#64374: The compiler’s parser has this type:
pub type PResult<'a, T> = Result
It’s used as the return type for a lot of parsing functions. The T value is always small, but DiagnosticBuilder was 176 bytes, so PResult had a minimum size of 184 bytes. And DiagnosticBuilder is only needed when there is a parsing error, so this was egregiously inefficient. This PR boxed DiagnosticBuilder so that PResult has a minimum size of 16 bytes, speeding up a number of benchmarks by up to 2.6%.
#64394: This PR reduced the size of the SubregionOrigin type from 120 bytes to 32 bytes by boxing its largest variant, which sped up many benchmarks slightly (by less than 1%). If you are wondering why this type caused memcpy calls despite being less than 128 bytes, it’s because it is used in a BTreeMap and the tree nodes exceeded 128 bytes.
One of the biggest causes of memcpy calls is within a data structure called ObligationForest, which represents a bunch of constraints (relating to type checking and trait resolution, I think) that take the form of a collection of N-ary trees. ObligationForest uses a single vector to store the tree nodes, and links between nodes are represented as numeric indices into that vector.
Nodes are regularly removed from this vector by a function called ObligationForest::compress. This operation is challenging to implement efficiently because the vector can contain thousands of nodes and nodes are removed only a few at a time, and order must be preserved, so there is a lot of node shuffling that occurs. (The numeric indices of all remaining nodes must be updated appropriately afterwards, which further constrains things.) The shuffling requires lots of swap calls, and each one of those does three memcpy calls (let tmp = a; a = b; b = tmp, more or less). And each node is 176 bytes! While trying to get rid of these memcpy calls, I got very deep into ObligationForest and made the following PRs that aren’t related to the copying.
#64420: This PR inlined a hot function, speeding up a few benchmarks by up to 2.8%. The function in question is indirectly recursive, and LLVM will normally refuse to inline such functions. But I was able to work around this by using a trick: creating two variants of the function, one marked with #[inline(always)] (for the hot call sites) and one marked with #[inline(never)] (for the cold call sites).
#64500: This PR did a bunch of code clean-ups, some of which helped performance to the tune of up to 1.7%. The improvements came from factoring out some repeated expressions, and using iterators and retain instead of while loops in some places.
#64545: This PR did various things, improving performance by up to 13.8%. The performance wins came from: combining a split parent/descendants representation to avoid frequent chaining of iterators (chained iterators are inherently slower than non-chained iterators); adding a variant of the shallow_resolve function specialized for the calling pattern at a hot call site; and using explicit iteration instead of Iterator::all. (More about that last one below.)
#64627: This PR also did various things, improving performance by up to 18.4%. The biggest improvements came from: changing some code that dealt with a vector to special-case the 0-element and 1-element cases, which dominated; and inlining an extremely hot function (using a variant of the abovementioned #[inline(always)] + #[inline(never)] trick).
These PRs account for most of the improvements to the following benchmarks: inflate, keccak, cranelift-codegen, and serde. Parts of the ObligationForest code was so hot for these benchmarks (especially inflate and keccak) that it was worth micro-optimizing them to the nth degree. When I find hot code like this, there are always two approaches: (a) try to speed it up, or (b) try to avoid calling it. In this case I did (a), but I do wonder if the users of ObligationForest could be more efficient in how they use it.
The above PRs are a nice success story, but I should also mention that I tried a ton of other micro-optimizations that didn’t work.
drain_filter in compress. It was slower.swap_and_remove instead of swap in compress, This gave speed-ups, but changed the order that predicates are processed in, which changed the order and/or contents of error messages produced in lots of tests. I was unable to tell if these error message changes were legitimate — some were simple, but some were not — so I abandoned all approaches that altered predicate order.ObligationForest nodes, to reduce the number of bytes copied in compress. It reduced the amount of copying, but was a net slowdown because it increased the number of allocations performed.unsafe code to remove the swap calls, but the speed-up was only 1% in the best case and I wasn’t confident that my code was panic-safe, so I abandoned that effort.Amusingly enough, the memcpy calls in compress were what started all this, and despite the big wins, I didn’t manage to get rid of them!
I mentioned above that in #64545 I got an improvement by replacing a hot call to Iterator::all with explicit iteration. The reason I tried this was that I looked at the implementation of Iterator::all and saw that it was surprisingly complicated: it wrapped the given predicate in a closure that
returned a LoopState, passed that closure to try_for_each which
wrapped the first closure in a second closure, and passed that second closure
to try_fold which did the actual iteration using the second
closure. Phew!
Just for kicks I tried replacing this complex implementation with the obvious, simple implementation, and got a small speed-up on keccak, which I was using for most of my performance testing. So I did the same thing for three similar Iterator methods (any, find and find_map), submitted #64572, and did a CI perf run. The results were surprising and extraordinary: 1-5% reductions for many benchmarks, but double-digits for some, and 20-50% reductions for some clap-rs runs. Uh, what? Investigation showed that the reduction came from LLVM doing less work during code generation. These functions are all marked with #[inline] and so the simpler versions result in less code for LLVM to process. Sure enough, the big wins all came in debug and opt builds, with little effect on check builds.
This surprised me greatly. There’s been a long-running theory that the LLVM IR produced by the Rust compiler’s front end is low quality, that LLVM takes a long time to optimize it, and more front-end optimization could speed up LLVM’s code generation. #64572 demonstrates a related, but much simpler prospect: we can speed up compilation by making commonly inlined library functions smaller. In hindsight, it makes sense that this would have an effect, but the size of the effect is nonetheless astounding to me.
But there’s a trade-off. Sometimes a simpler, smaller function is slower. For the iterator methods there are some cases where that is true, so the library experts were unwilling to land #64572 as is. Fortunately, it was possible to obtain much of the potential compile time improvements without compromising runtime.
try_fold for slices that had an unrolled loop that called the given closure four times. This got about 60% of the improvements of #64572.Iterator methods to call try_fold directly, removing one closure layer. This got about another 15% of the improvements of #64572.I had a related idea, which was to use simpler versions for debug builds and complex versions for opt builds. I tried three different ways of doing this.
if cfg!(debug_assertions) within the method bodies.#[cfg(debug_assertions)], the other marked with #[cfg(not(debug_assertions))].#[cfg_attr(debug_assertions, inline)] so that the methods are inlined only in optimized builds.None of these worked; they either had little effect or made things worse. I’m hazy on the details of how library functions get incorporated; maybe there’s another way to make this idea work.
In a similar vein, Alex Crichton opened #64846, which changes hashbrown (Rust’s hash table implementation) so it is less aggressive about inlining. This got some sizeable improvements on some benchmarks (up to 18% on opt builds of cargo) but also caused small regressions for a lot of other benchmarks. In this case, the balance between “slower hash tables” and “less code to compile” is delicate, and a final decision is yet to be made.
Overall, this is an exciting new area of investigation for improving Rust compile times. We definitely want new tooling to help identify which library functions are causing the most code bloat. Hopefully these functions can be tweaked so that compile times improve without hurting runtime performance much.
As well as all the above stuff, which all arose due to my investigations into memcpy calls, I had a few miscellaneous improvements that arose from normal profiling.
#65089: In #64673, simulacrum got up to 30% wins on the unicode_normalization benchmark by special-casing a type size computation that is extremely hot. (That benchmark is dominated by large match expressions containing many integral patterns.) Inspired by this, in this PR I made a few changes that moved the special case to a slightly earlier point that avoided even more unnecessary operations, for wins of up to 11% on that same benchmark.
#64949: The following pattern occurs in a few places in the compiler.
let v = self.iter().map(|p| p.fold_with(folder)).collect::>()
I.e. we map some values into a SmallVec. A few of these places are very hot, and in most cases the number of elements produced is 0, 1, or 2. This PR changed those hot locations to handle one or more of the 0/1/2 cases directly without using iteration and SmallVec::collect, speeding up numerous benchmarks by up to 7.8%.
#64801: This PR avoided a chained iterator in a hot location, speeding up the wg-grammar benchmark by up to 1.9%.
Finally, in #64112 I tried making pipelinined compilation more aggressive by moving crate metadata writing before type checking and borrow checking. Unfortunately, it wasn’t much of a win, and it would slightly delay error message emission when compiling code with errors, so I abandoned the effort.
https://blog.mozilla.org/nnethercote/2019/10/11/how-to-speed-up-the-rust-compiler-some-more-in-2019/
|
|
Benjamin Bouvier: Improving my Github workflow |
Since I've been working on a Github project for a while now, I thought now would be a good time to gather ways to make it easier to work with Github pull requests (PRs). In particular, it's easy to drown yourself in the incoming flow of Github emails.
This post is for you if:
Here are a few tricks I've collected over the years that make it easier to deal with a few things, focusing on Github notifications and emails, since they were the largest issue for me. This is not an exhaustive list of all the nice features Github has, or all the WebExtensions that could help with Github: it is a few things that work for me and are worth sharing. Note that I go from the most mundane to the more specific advices here.
If you're working on several projects, Github can end up sending you too many email notifications.
It's possible to disable some kinds of notifications entirely in the settings, but that's too radical for my needs.
However, Github has a notification dashboard that displays all the activity related to repositories you're watching or issues/pull-requests you're involved in. It's easy to dismiss all the notifications of all projects at once, or per project. There's a tab on the left that allows to select more precisely your level of involvement in the issue: did you participate in it? You can also save some notifications for later, so they're not deleted once you've clicked them; they'll appear under the "Saved for later" tab — I just discovered this!
Note that Github may also send these notifications by email, if you've decided to do so. In this case, I'd strongly recommend allowing the downloads of images in Github emails. Despite the bad effect on your privacy this might have by allowing user tracking, it will also synchronize the notifications' read state, which is nice.

See how I am totally in control of my notifications? Truth is, I don't need notifications in general, because I'm usually more interested in reviews I need to receive and give.
Github allows to assign a reviewer to a pull request. At Mozilla, we require a formal review for each change in the code base, unless it's really not meaningful (like, removing trailing whitespaces). Even documentation and tests changes may require a review, depending on the rules of the code module you're working on.
It is very common that a pull request is received with requests for additional changes. In this case, it is important to explicitly re-request a review, otherwise this breaks all the review tracking Github proposes.
Now Github has two interesting pages for this:
When I know my way around a project, I'll frequently need to see the content of a particular file or directory, that might be a few directories deep. On Github, this means going to the files view, clicking once per directory (at most), and finding the file I want.
The pull request view doesn't show the directory hierarchy and which files of which directory have been touched, which is a light inconvenience too.
Good news, everyone! There is one WebExtension called Octotree that adds a directory view within a panel to the left of Github's UI. By default, it's folded and doesn't take much space; you need to hover it with the mouse to make it appear. On pull requests, it will show files that have been modified with the diff summary for each file. Note the website shows features from the PRO version, but there's a free version that addresses the needs detailed above.
This is an example of the Octotree panel on our project's repository:

To be honest, I haven't investigated using the search bar, which could be quite handy for this too, especially thanks to keyboard shortcuts.
If you're using Github for personal and work related projects, you might have been bothered by work emails coming into your personal mailbox. That has happened to me in the past, causing some unnecessary mental load over the weekend and unnecessarily breaking the state of relaxation.
Fortunately, Github allows you to redirect emails from a particular Github Organization to a specific email address. Of course, this only works when the repository is owned by an organization and you're part of this organization.
I'm lucky to work on such projects at the moment. It's not a silver bullet though, because some projects are sometimes owned by personal accounts, making this trick useless. As far as I know, there are no good solutions in this case.
The biggest remaining offender certainly is Github emails, in general. Fortunately, Github has made it easy to filter them. I'll mention examples in the Gmail email client, since that's what we're using at work, but these apply to any other modern email client too.
Each email coming from a specific project comes with a mailing list-id, which
is a specific header that some email clients know how to interpret. For
instance, in Gmail, when you click on the small arrow next to the list of
recipients, you'll see many details about the current email, including, if
there's one, the "mailing-list" id, and a link to automatically create a filter
for this mailing-list. That allows you to create a particular directory/tag in
which the filter can automatically put all the emails with this id.
In addition to filtering by project (and this is where Gmail tags / Thunderbird's saved searches truly shine), it's also possible to infer more information from the Github email notifications, by looking at the list of recipients or custom email headers.
Indeed, when there's a specific reason why an email was sent to you, Github
will add a (fake) recipient in the CC field, its address username being the
reason why the email was sent to you. For instance, in an email telling me that
somebody requested a review from me, the email address
review_requested@github.com will appear in the CC list. If you look at the
full message, you'll also see the custom email header X-GitHub-Reason set to
review_requested.
All the possible reasons are detailed in Github's documentation.
These extra CC email addresses and email headers allow creating very powerful filters that add supplementary tags to an email. For me, they relate directly to the importance of the incoming email: reviews and mentions are usually something I pay very close attention to, and thus they get filtered in a special top-level tag in Gmail.
Here's an example of all the information you might find about a given email in Gmail: in particular, look at the CC list and mailing-list type ids.
Note that Gitlab also adds some similar custom headers that can be filtered by some powerful email clients. I won't go into detail about those.
If you're working on Mozilla code, Gecko and/or external projects, there's this neat addon that Mike Conley made. It will add an icon to the Firefox button bar, showing you the number of requests assigned to you on Github and Phabricator, as well as the number of pending Bugzilla requests.
It requires a minimal setup step for Github (filling your username) and Bugzilla (adding a Bugzilla API token), and then it Just Works. It smartly reuses a Phabricator token from the current Firefox Container's session, if there's one.
You may think that having such a display all the time might provoke anxiety during non-working hours. And you'd be right to think so! So the author of the addon has added a feature to not display this information outside working hours, that you can define as you like. Great stuff!
Thanks for reading this far! I hope this helped you to some extent, allowing you to spend less time in Github and more time doing the actual work. If you have more interesting tips for using Github effectively, feel free to add a comment or ping me on twitter!
|
|
Mozilla Addons Blog: Extensions in Firefox 70 |
Welcome to another round of new additions and changes to extensions, this time in Firefox 70. We have a new API, some improvements on existing APIs, and some great additions to Firefox Developer Tools to make it easier to debug your extensions.
Firefox 70 features a new network status API. It can be used to determine if an internet connection is available and provides insight into what type of connection the user is on. A potential use case for this would be for developers to limit the data they are transferring on a mobile connection. Here is an example:
async function upload(url, buffer) {
  let info = await browser.networkStatus.getLinkInfo();
  let isMobile = ["wimax", "2g", "3g", "4g"].includes(info.type);

  // Only sending every second byte on mobile. Clever savings, eh?
  let body = buffer;
  if (isMobile) {
    body = body.filter((elem, index) => index % 2 == 0);
  }

  console.log(`Uploading via ${info.type} connection named ${info.id}`);

  switch (info.status) {
    case "down":
      await handleOfflineMode(url, buffer);
      break;
    case "up":
    case "unknown":
      await fetch(url, {
        method: "POST",
        headers: { "Content-Type": "application/octet-stream" },
        body: body
      });
      break;
  }
}
There is also an onConnectionChanged event available that is called with the changed link info.
We’ve made a few improvements to the downloads API in Firefox 70. By popular request, the Referer header is now allowed in the browser.downloads.download API’s headers object. This allows extensions, such as download managers, to download files for sites that require a referrer to be set.
Also, we’ve improved error reporting for failed downloads. In addition to previously reported failures, the browser.downloads.download API will now report an error in case of various http 4xx failures. This makes the API more compatible with Chrome and gives developers a way to react to these errors in their code. [Edit: Sorry if I got your hopes up! This is actually coming in Firefox 71!]
If you are using the browser.privacy.network API and are modifying webRTCIPHandlingPolicy, we’ve made some compatibility changes to the disable_non_proxied_udp setting. This setting now better matches Chrome’s behavior. If your add-on relied on the Firefox-specific behavior, you can make use of the new setting proxy_only.
Starting in Firefox 70, Firefox finally supports inspecting data from the browser.storage API using the Devtools Storage Inspector. When you inspect an add-on via about:debugging, you will find a new Extension Storage section in the storage panel. While changing the values is not currently supported, this will make debugging your add-ons even easier.
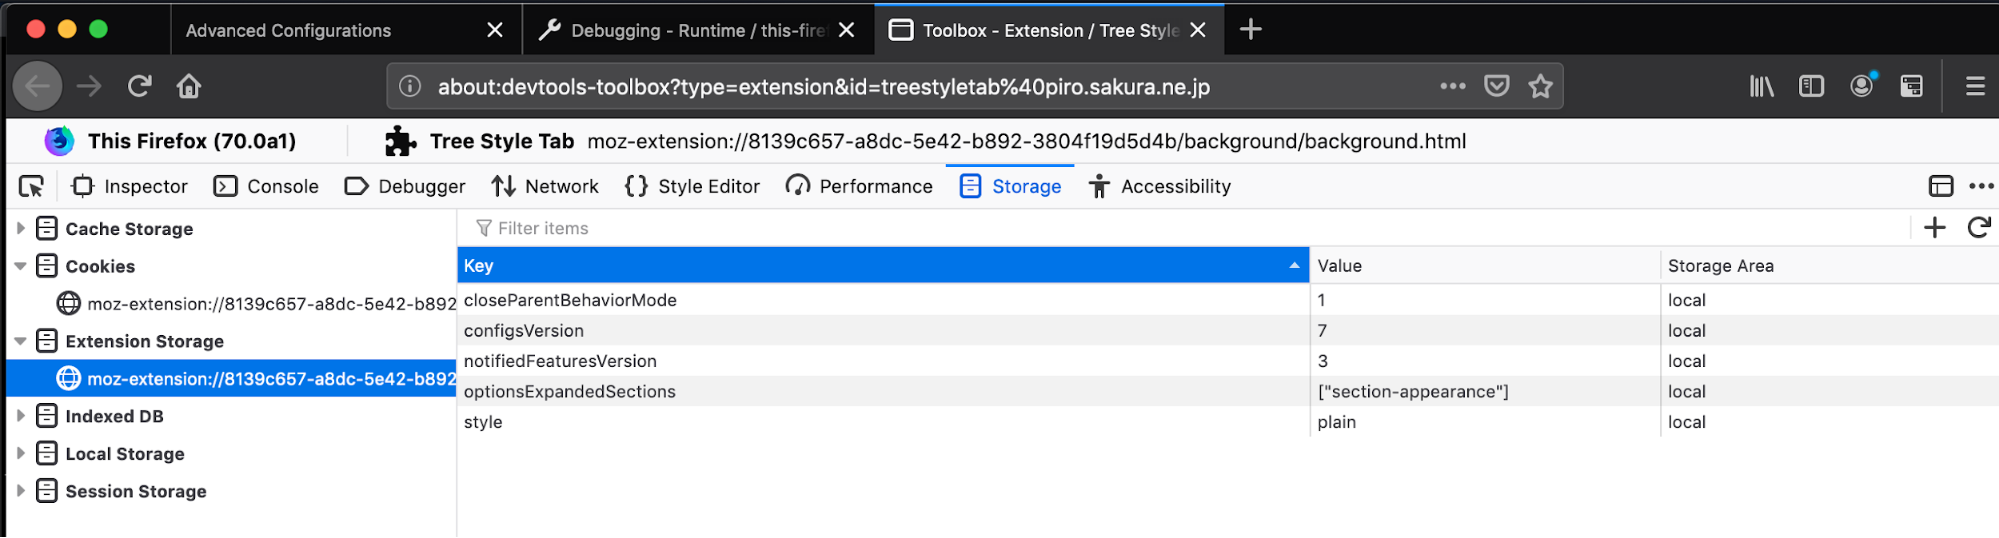
Extension Storage Inspector
The accentcolor, headerURL and text_color properties are now unsupported. Please make use of the replacement properties frame, theme_frame, and tab_background_text. You can find more information on our previous deprecation announcement.
Special thanks this time goes to our volunteers Trishul Goel, Myeongjun Go, Graham McKnight and Tom Schuster. We’ve also received an awesome contribution from Mandy Cheang as part of her internship at Mozilla. Keep up the great work everyone!
The post Extensions in Firefox 70 appeared first on Mozilla Add-ons Blog.
https://blog.mozilla.org/addons/2019/10/10/extensions-in-firefox-70/
|
|
Nicholas Nethercote: Visualizing Rust compilation |
Speeding up the Rust compiler isn’t the only way to make a Rust project build faster. Changing the crate structure of a project can also make a big difference. The good news here is that Eric Huss has implemented an amazing tool for visualizing Rust compilation, which can be used to identify inefficient crate structures in Rust projects.
The tool extremely easy to use. First, update to the latest Nightly:
rustup update nightly
Then just add -Ztimings to your build command, e.g.:
cargo +nightly build -Ztimings
At the end of the build it will print the name of an HTML file containing the data. Here’s part of the visualization for the Rust compiler itself:
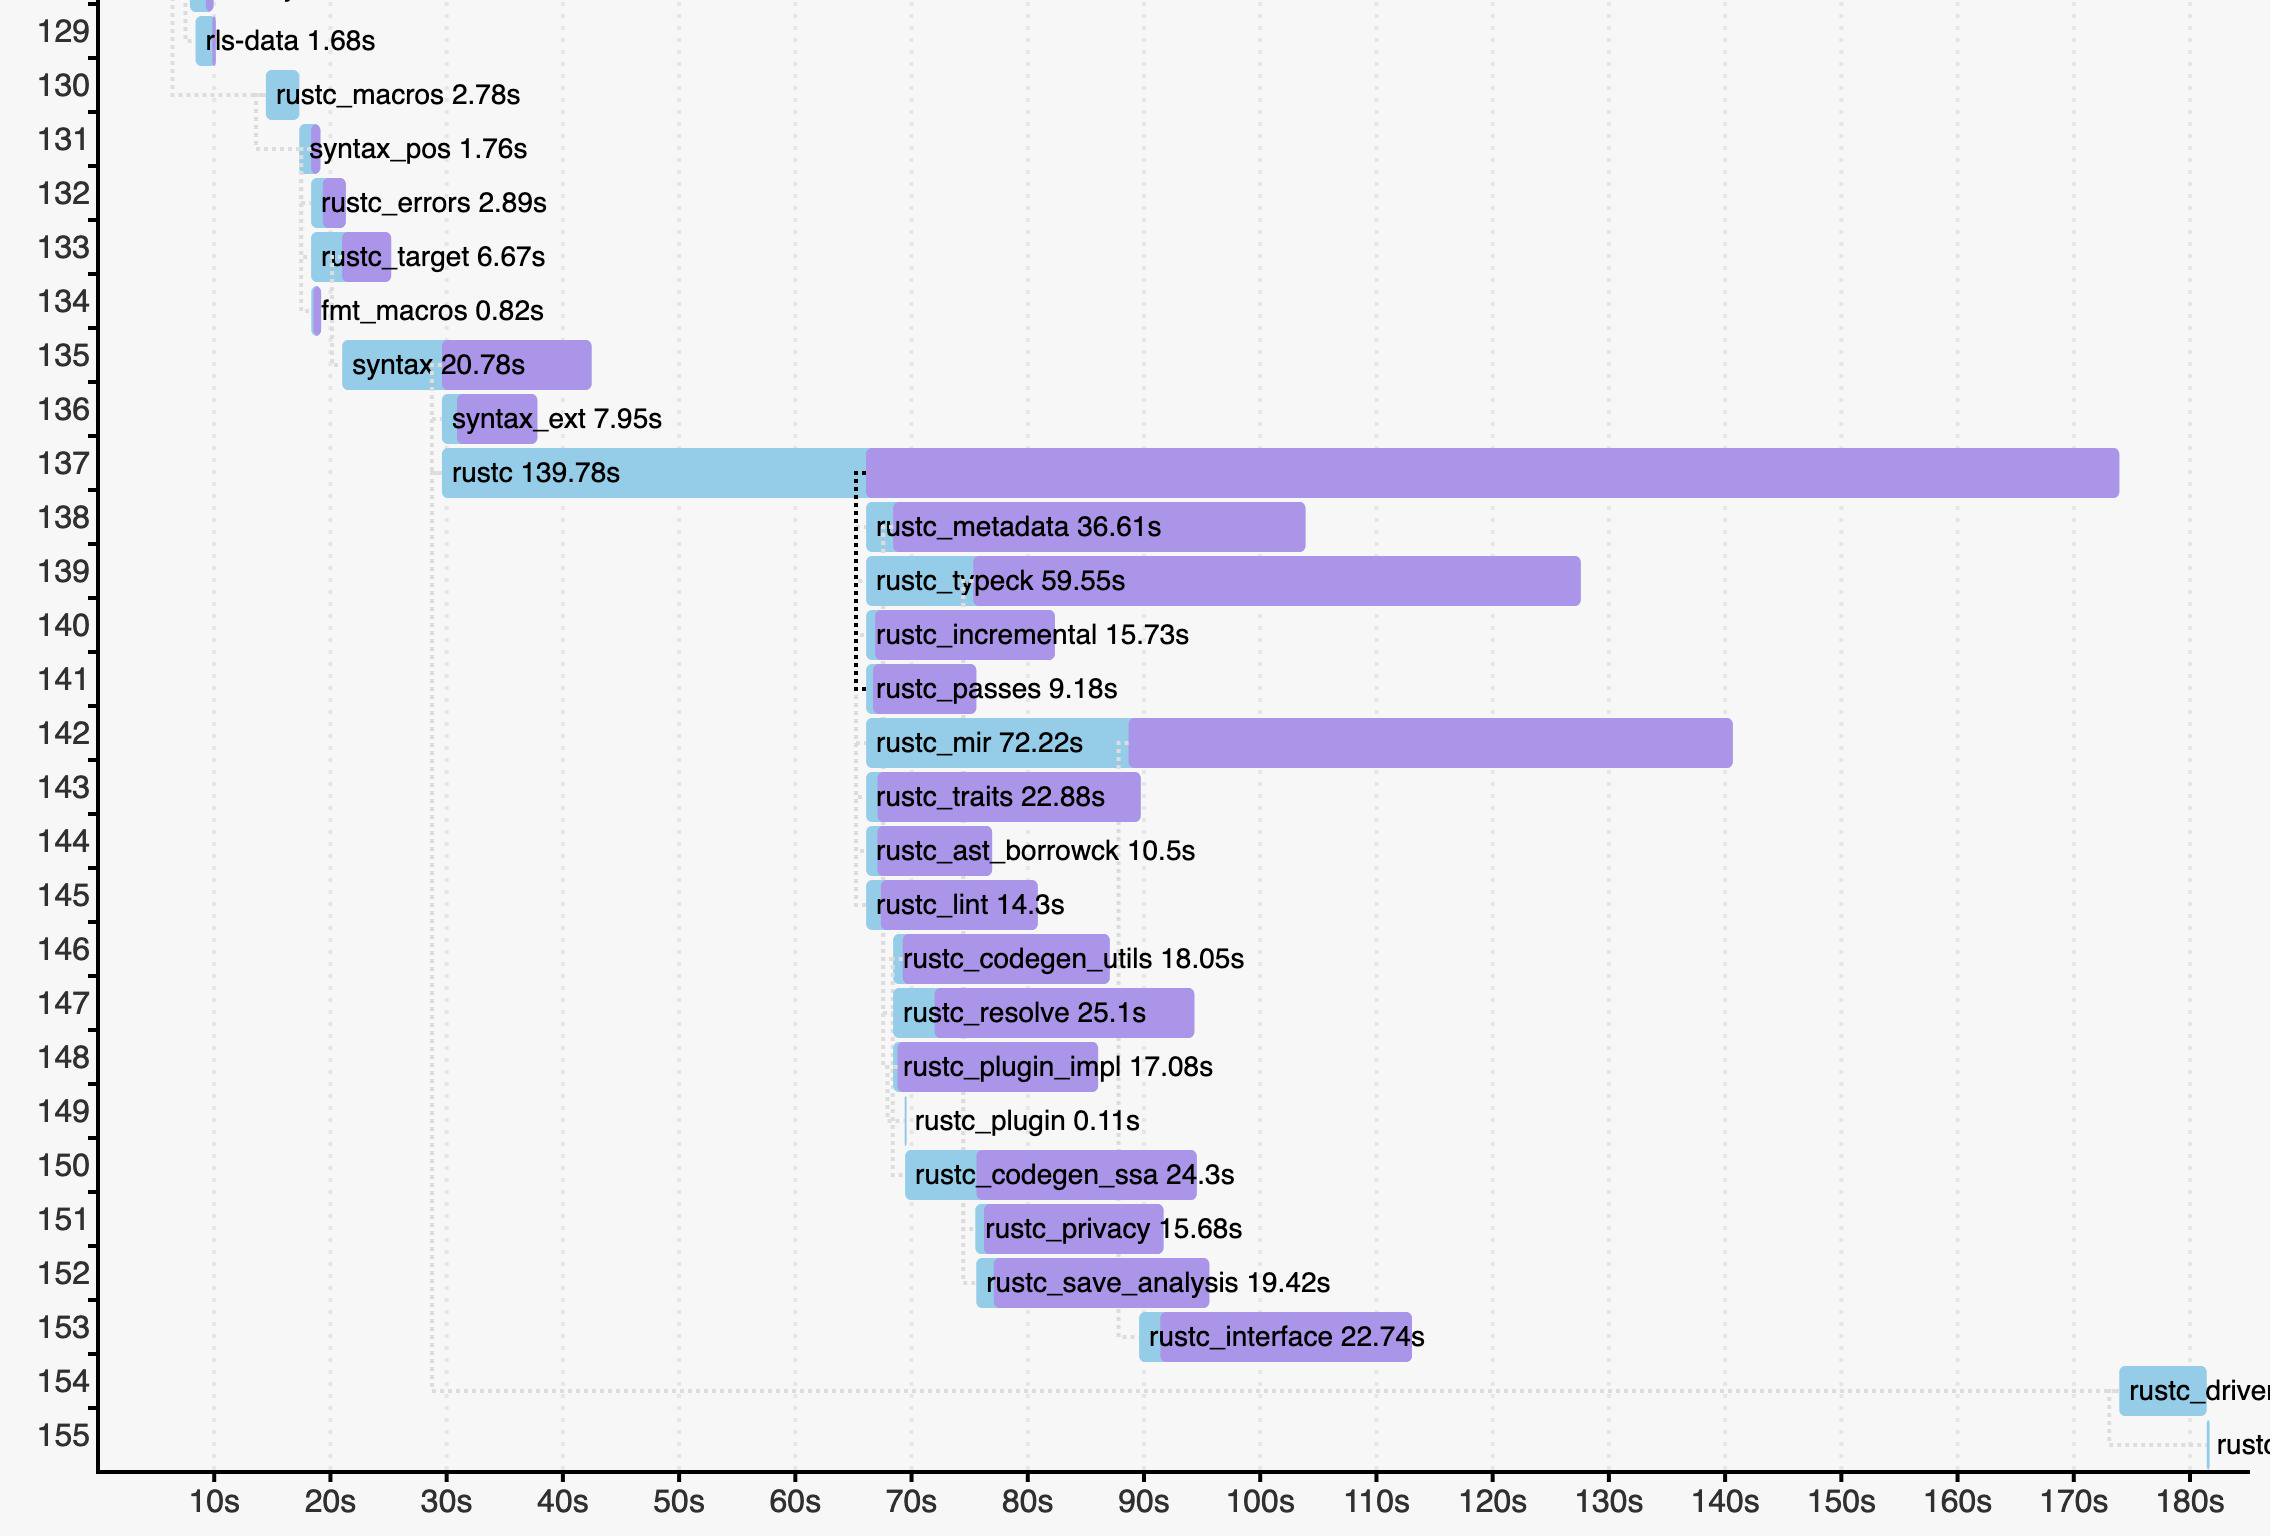
Full data is available here. (I recommend moving the “Scale” slider to 7 or 8 so that horizontal scrolling isn’t necessary.)
Two things leap out from this visualization.
I also filed #65088 to add -Ztimings support to the Rust compiler’s own build system. (Enabling the visualization isn’t as simple for the compiler as it is for most Rust projects. The compiler’s build system is complicated by the fact that it’s a bootstrapping compiler that has to be built multiple times.)
We have already heard from multiple people that they used it fix inefficiencies in their crate structure, speeding up their builds significantly. Anyone who works on a sizeable Rust project should try out this tool.
https://blog.mozilla.org/nnethercote/2019/10/10/visualizing-rust-compilation/
|
|


