Firefox Nightly: These Weeks in Firefox: Issue 3 |
The Firefox Desktop team met yet again last Tuesday to share updates. Here are some fresh updates that we think you might find interesting:
Here are the raw meeting notes that were used to derive this list.
Want to help us build Firefox? Get started here!
Here’s a tool to find some mentored, good first bugs to hack on.
https://blog.nightly.mozilla.org/2016/10/17/these-weeks-in-firefox-issue-3/
|
|
Firefox Nightly: Better default bookmarks for Nightly |
Because software defaults matter, we have just changed the default bookmarks for the Nightly channel to be more useful to power-users deeply interested in day to day progress of Firefox and potentially willing to help Mozilla improve their browser through bug and crash reports, shared telemetry data and technical feedback.
Users on the Nightly channels had the same bookmarks than users on the release channel, these bookmarks target end-users with limited technical knowledge and link to Mozilla sites providing end-user support, add-ons or propose a tour of Firefox features. Not very compelling for a tech-savvy audience that installed pre-alpha software!
As of last week, new Nightly users or existing Nightly users creating a new profile have a different set of bookmarks that are more likely to meet their interest in the technical side of Mozilla and contributing to Firefox as an alpha tester. Here is what the default bookmarks are:

There are links to this blog of course, to Planet Mozilla, to the Mozilla Developer Network, to the Nightly Testers Tools add-on, to about:crashes and to the IRC #nightly channel in case you find a bug and would like to talk to other Nightly users about it and of course a link to Bugzilla. The Firefox tour link was also replaced by a link to the contribute page on mozilla.org.
It’s a minor change to the profile data as we don’t want to make of Nightly a different product from Firefox, but I hope another small step in the direction of empowering our more technical user base to help Mozilla build the most stable and reliable browser for hundreds of millions of people!
https://blog.nightly.mozilla.org/2016/10/17/better-default-bookmarks-for-nightly/
|
|
Giorgos Logiotatidis: Systemd Unit to activate loopback devices before LVM |
In a Debian server I'm using LVM to create a single logical volume from multiple different volumes. One of the volumes is a loop-back device which refers to a file in another filesystem.
The loop-back device needs to be activated before the LVM service starts or the
later will fail due to missing volumes. To do so a special systemd unit needs to
be created which will not have the default dependencies of units and will get
executed before lvm2-activation-early service.
Systemd will set a number of dependencies for all units by default to bring the system into a usable state before starting most of the units. This behavior is controlled by DefaultDependencies flag. Leaving DefaultDependencies to its default True value creates a dependency loop which systemd will forcefully break to finish booting the system. Obviously this non-deterministic flow can result in different than desired execution order which in turn will fail the LVM volume activation.
Setting DefaultDependencies to False will disable all but essential dependencies and will allow our unit to execute in time. Systemd manual confirms that we can set the option to false:
Generally, only services involved with early boot or late shutdown should set this option to false.
The second is to execute before lvm2-activation-early. This is simply achieved
by setting Before=lvm2-activation-early.
The third and last step is to set the command to execute. In my case it's
/sbin/losetup /dev/loop0 /volume.img as I want to create /dev/loop0 from the
file /volume.img. Set the process type to oneshot so systemd waits for the
process to exit before it starts follow-up units. Again from the systemd manual
Behavior of oneshot is similar to simple; however, it is expected that the process has to exit before systemd starts follow-up units.
Place the unit file in /etc/systemd/system and in the next reboot the
loop-back device should be available to LVM.
Here's the final unit file:
[Unit]
Description=Activate loop device
DefaultDependencies=no
After=systemd-udev-settle.service
Before=lvm2-activation-early.service
Wants=systemd-udev-settle.service

[Service]
ExecStart=/sbin/losetup /dev/loop0 /volume.img
Type=oneshot

[Install]
WantedBy=local-fs.target
See also: - Anthony's excellent LVM Loopback How-To
https://giorgos.sealabs.net/systemd-unit-to-activate-loopback-devices-before-lvm.html
|
|
Firefox Nightly: DevTools now display white space text nodes in the DOM inspector |
Web developers don’t write all their code in just one line of text. They use white space between their HTML elements because it makes markup more readable: spaces, returns, tabs.
In most instances, this white space seems to have no effect and no visual output, but the truth is that when a browser parses HTML it will automatically generate anonymous text nodes for elements not contained in a node. This includes white space (which is, after all a type of text).
If these auto generated text nodes are inline level, browsers will give them a non-zero width and height, and you will find strange gaps between the elements in the context, even if you haven’t set any margin or padding on nearby elements.
This behaviour can be hard to debug, but Firefox DevTools are now able to display these whitespace nodes, so you can quickly spot where do the gaps come from in your markup, and fix the issues.
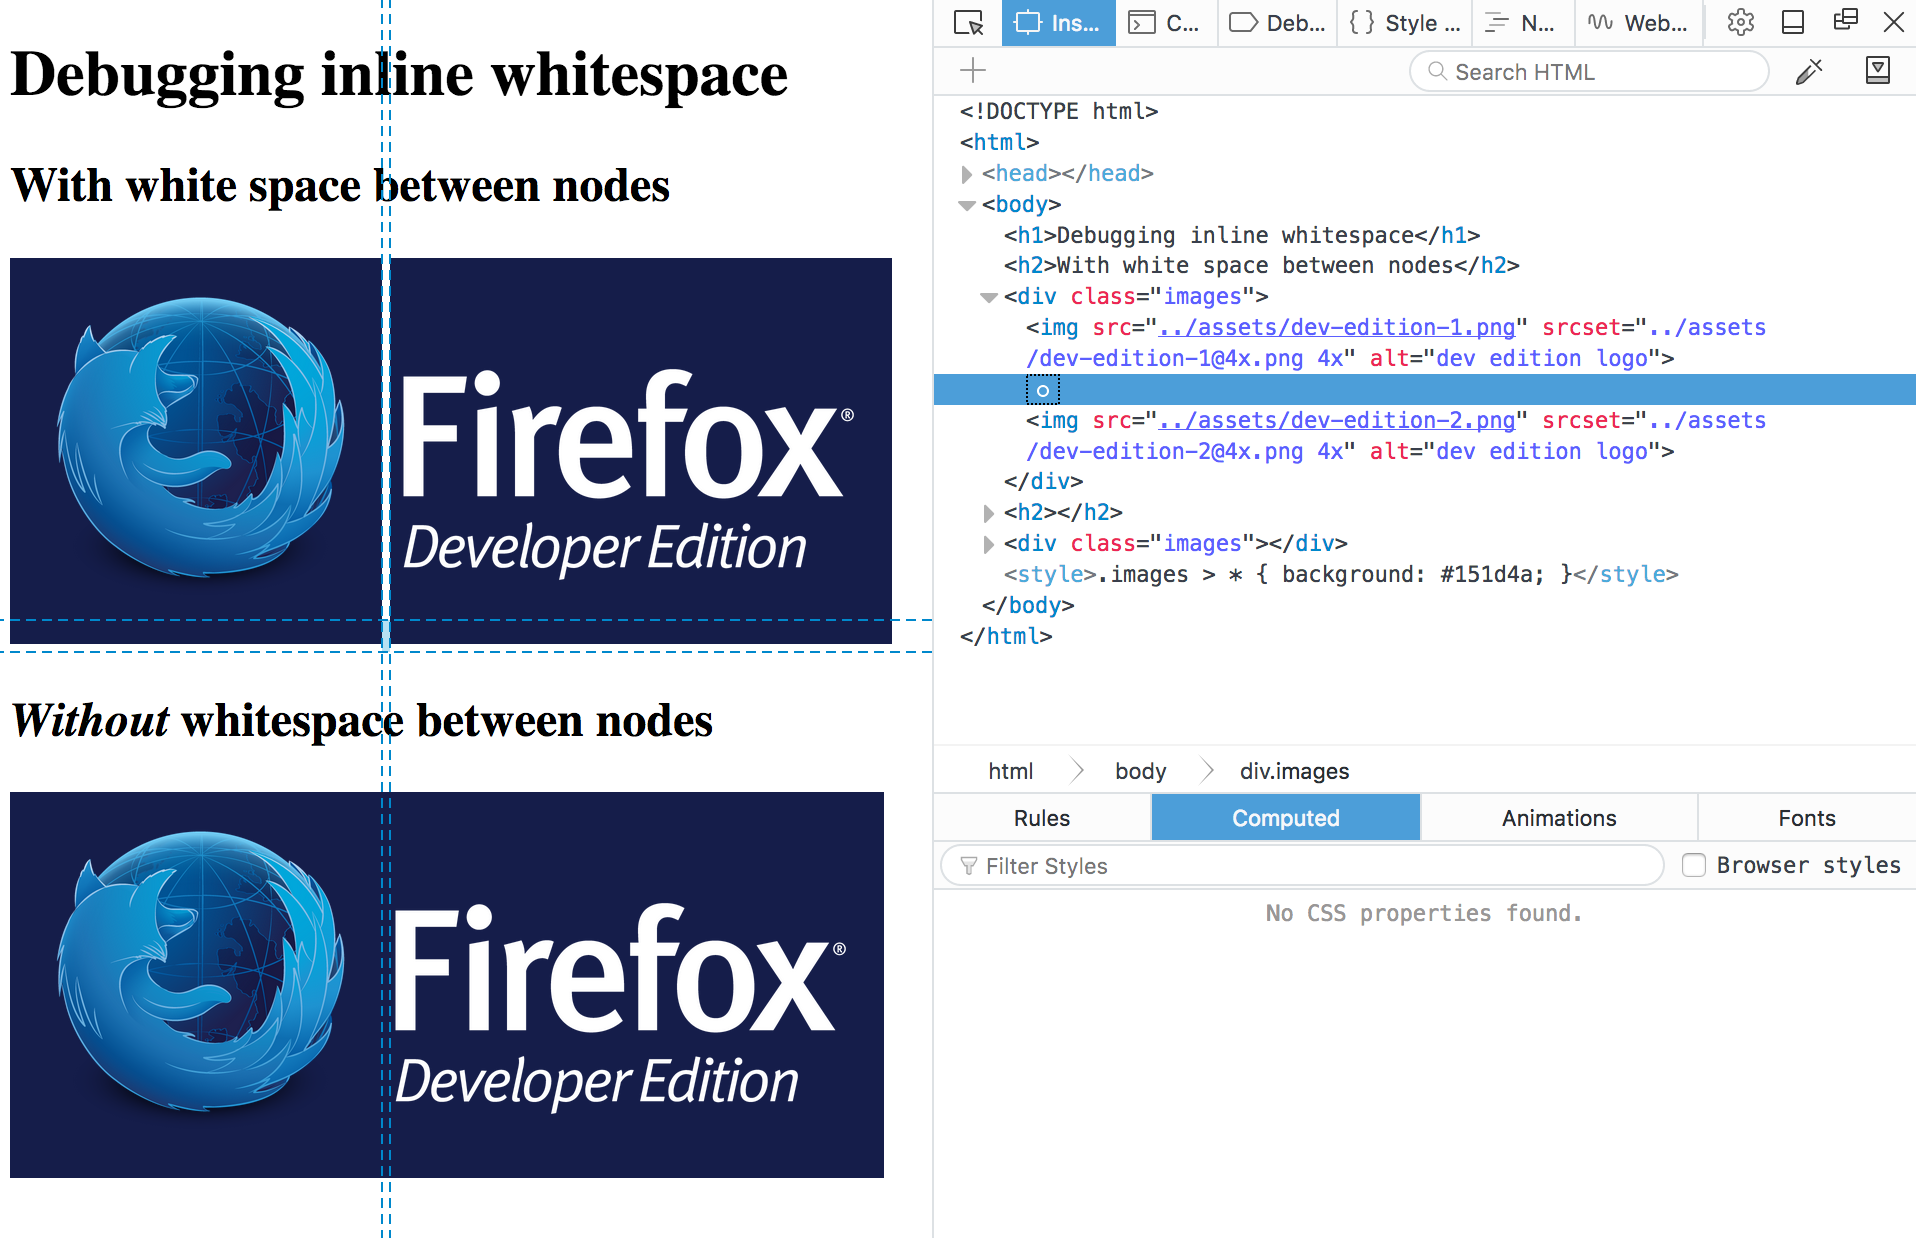
The demo shows two examples with slightly different markup to highlight the differences both in browser rendering and what DevTools are showing.
The first example has one img per line, so the markup is readable, but the browser renders gaps between the images:

The second example has all the img tags in one line, which makes the markup unreadable, but it also doesn’t have gaps in the output:
If you inspect the nodes in the first example, you’ll find a new whitespace indicator that denotes the text nodes created for the browser for the whitespace in the code. No more guessing! You can even delete the node from the inspector, and see if that removes mysterious gaps you might have in your website.
|
|
Robert O'Callahan: Ironic World Standards Day |
Apparently World Standards Day is on October 14. Except in the USA it's celebrated on October 27 and in Canada on October 5.
Are they trying to be ironic?
http://robert.ocallahan.org/2016/10/ironic-world-standards-day.html
|
|
Cameron Kaiser: It's Talos time (plus: 45.5.0 beta 2 now with more AltiVec IDCT) |
Let's not mince words, however: it's also not cheap, and you're gonna plunk down a lot if you want this machine. The board runs $4100 and that's without the CPU, which is pledged for separately though you can group them in the same order (this is a little clunky and I don't know why Raptor did it this way). To be sure, I think we all suspected this would be the case but now it's clear the initial prices were underestimates. Although some car repairs and other things have diminished my budget (I was originally going to get two of these), I still ponied up for a board and for one of the 190W octocore POWER8 CPUs, since this appears to be the sweetspot for those of us planning to use it as a workstation (remember each core has eight threads via SMT for a grand total of 64, and this part has the fastest turbo clock speed at 3.857GHz). That ran me $5340. I think after the RAM, disks, video card, chassis and PSU I'll probably be all in for around $7000.
Too steep? I don't blame you, but you can still help by donating to the project and enable those of us who can afford to jump in first to smoothe the way out for you. Frankly, this is the first machine I consider a meaningful successor to the Quad G5 (the AmigaOne series isn't quite there yet). Non-x86 doesn't have the economies of scale of your typical soulless Chipzilla craptop or beige box, but if we can collectively help Raptor get this project off the ground you'll finally have an option for your next big machine when you need something free, open and unchained -- and there's a lot of chains in modern PCs that you don't control. You can donate as little as $10 and get this party started, or donate $250 and get to play with one remotely for a few months. Call it a rental if you like. No, I don't get a piece of this, I don't have stock in Raptor and I don't owe them a favour. I simply want this project to succeed. And if you're reading this blog, odds are you want that too.
The campaign ends December 15. Donate, buy, whatever. Let's do this.
My plans are, even though I confess I'll be running it little-endian (since unfortunately I don't think we have much choice nowadays), to make it as much a true successor to the last Power Mac as possible. Yes, I'll be sinking time into a JIT for it, which should fully support asm.js to truly run those monster applications we're seeing more and more of, porting over our AltiVec code with an endian shift (since the POWER8 has VMX), and working on a viable and fast way of running legacy Power Mac software on it, either through KVM or QEMU or whatever turns out to be the best option. If this baby gets off the ground, you have my promise that doing so will be my first priority, because this is what I wanted the project for in the first place. We have a chance to resurrect the Power Mac, folks, and in a form that truly kicks ass. Don't waste the opportunity.
Now, having said all that, I do think Raptor has made a couple tactical errors. Neither are fatal, but neither are small.
First, there needs to be an intermediate pledge level between the bare board and the $18,000 (!!!!) Warren Buffett edition. I have no doubt the $18,000 machine will be the Cadillac of this line, but like Cadillacs, there isn't $18,000 worth of parts in it (maybe, maybe, $10K), and this project already has a bad case of sticker shock without slapping people around with that particular dead fish. Raptor needs to slot something in the middle that isn't quite as wtf-inducing and I'll bet they'll be appealing to those people willing to spend a little more to get a fully configured box. (I might have been one of those people, but I won't have the chance now.)
Second, the pledge threshold of $3.7 million is not ludicrous when you consider what has to happen to manufacture these things, but it sure seems that way. Given that this can only be considered a boutique system at this stage, it's going to take a lot of punters like yours truly to cross that point, which is why your donations even if you're not willing to buy right now are critical to get this thing jumpstarted. I don't know Raptor's finances, but they gave themselves a rather high hurdle here and I hope it doesn't doom the whole damn thing.
On the other hand, doesn't look like Apple's going to be updating the Mac Pro any time soon, so if you're in the market ...
On to 45.5.0 beta 2 (downloads, hashes). The two major changes in this version is that I did some marginal reduction in the overhead of graphics primitives calls, and completed converting to AltiVec all of the VP9 inverse discrete cosine and Hadamard transforms. Feel free to read all 152K of it, patterned largely off the SSE2 version but still mostly written by hand; I also fixed the convolver on G4 systems and made it faster too. This is probably the biggest amount of time required by the computer while decoding frames. I can do some more by starting on the intraframe predictors but that will probably not yield speed ups as dramatic. My totally unscientific testing is yielding these recommendations for specific machines:
1.0GHz iMac G4 (note: not technically supported, but a useful comparison): maximum watchable resolution 144p VP9
1.33GHz iBook G4, reduced performance: same
1.33GHz iBook G4, highest performance: good at 144p VP9, max at 240p VP9, but VP8 is better
1.67GHz DLSD PowerBook G4: ditto, VP8 better here too
2.5GHz Quad G5, reduced performance: good at 240p VP9, max at 360p VP9
2.5GHz Quad G5, highest performance: good at 360p VP9, max at 480p VP9
I'd welcome your own assessments, but since VP8 (i.e., MediaSource Extensions off) is "good enough" on the G5 and actually currently better on the G4, I've changed my mind again and I'll continue to ship with MSE turned off so that it still works as people expect. However, they'll still be able to toggle the option in our pref panel, which also was fixed to allow toggling PDF.js (that was a stupid bug caused by missing a change I forgot to pull forward into the released build). When VP9 is clearly better on all supported configurations then we'll reexamine this.
No issues have been reported regarding little-endian JavaScript typed arrays or our overall new hybrid endian strategy, or with the minimp3 platform decoder, so both of those features are go. Download and try it.
http://tenfourfox.blogspot.com/2016/10/its-talos-time-plus-4550-beta-2-now.html
|
|
Mozilla Addons Blog: Add-ons Update – 2016/10 |
Here’s the state of the add-ons world this month.
In the past month, 1,755 listed add-on submissions were reviewed:
There are 223 listed add-ons awaiting review.
If you’re an add-on developer and are looking for contribution opportunities, please consider joining us. Add-on reviewers are critical for our success, and can earn cool gear for their work. Visit our wiki page for more information.
The compatibility blog post for Firefox 50 is up, and the bulk validation was run recently. The compatibility blog post for Firefox 51 has published yesterday. It’s worth pointing out that the Firefox 50 cycle will be twice as long, so 51 won’t be released until January 24th, 2017.
Multiprocess Firefox is now enabled for users without add-ons, and add-ons will be gradually phased in, so make sure you’ve tested your add-on and either use WebExtensions or set the multiprocess compatible flag in your add-on manifest.
As always, we recommend that you test your add-ons on Beta and Firefox Developer Edition to make sure that they continue to work correctly. End users can install the Add-on Compatibility Reporter to identify and report any add-ons that aren’t working anymore.
We would like to thank Atique Ahmed Ziad, Surya Prashanth, freaktechnik, shubheksha, bjdixon, zombie, berraknil, Krizzu, rackstar17, paenglab, and Trishul Goel (long list!) for their recent contributions to the add-ons world. You can read more about their work in our recognition page.
https://blog.mozilla.org/addons/2016/10/14/add-ons-update-88/
|
|
Daniel Stenberg: a single byte write opened a root execution exploit |
Thursday, September 22nd 2016. An email popped up in my inbox.
Subject: ares_create_query OOB write
As one of the maintainers of the c-ares project I’m receiving mails for suspected security problems in c-ares and this was such a one. In this case, the email with said subject came from an individual who had reported a ChromeOS exploit to Google.
It turned out that this particular c-ares flaw was one important step in a sequence of necessary procedures that when followed could let the user execute code on ChromeOS from JavaScript – as the root user. I suspect that is pretty much the worst possible exploit of ChromeOS that can be done. I presume the reporter will get a fair amount of bug bounty reward for this.
The setup and explanation on how this was accomplished is very complicated and I am deeply impressed by how this was figured out, tracked down and eventually exploited in a repeatable fashion. But bear with me. Here comes a very simplified explanation on how a single byte buffer overwrite with a fixed value could end up aiding running exploit code as root.
The main Google bug for this problem is still not open since they still have pending mitigations to perform, but since the c-ares issue has been fixed I’ve been told that it is fine to talk about this publicly.
c-ares has a function called ares_create_query. It was added in 1.10 (released in May 2013) as an updated version of the older function ares_mkquery. This detail is mostly interesting because Google uses an older version than 1.10 of c-ares so in their case the flaw is in the old function. This is the two functions that contain the problem we’re discussing today. It used to be in the ares_mkquery function but was moved over to ares_create_query a few years ago (and the new function got an additional argument). The code was mostly unchanged in the move so the bug was just carried over. This bug was actually already present in the original ares project that I forked and created c-ares from, back in October 2003. It just took this long for someone to figure it out and report it!
I won’t bore you with exactly what these functions do, but we can stick to the simple fact that they take a name string as input, allocate a memory area for the outgoing packet with DNS protocol data and return that newly allocated memory area and its length.
Due to a logic mistake in the function, you could trick the function to allocate a too short buffer by passing in a string with an escaped trailing dot. An input string like “one.two.three\.” would then cause the allocated memory area to be one byte too small and the last byte would be written outside of the allocated memory area. A buffer overflow if you want. The single byte written outside of the memory area is most commonly a 1 due to how the DNS protocol data is laid out in that packet.
This flaw was given the name CVE-2016-5180 and was fixed and announced to the world in the end of September 2016 when c-ares 1.12.0 shipped. The actual commit that fixed it is here.
Ok, so a function can be made to write a single byte to the value of 1 outside of its allocated buffer. How do you turn that into your advantage?
The Redhat security team deemed this problem to be of “Moderate security impact” so they clearly do not think you can do a lot of harm with it. But behold, with the right amount of imagination and luck you certainly can!
Back to ChromeOS we go.
First, we need to know that ChromeOS runs an internal HTTP proxy which is very liberal in what it accepts – this is the software that uses c-ares. This proxy is a key component that the attacker needed to tickle really badly. So by figuring out how you can send the correctly crafted request to the proxy, it would send the right string to c-ares and write a 1 outside its heap buffer.
ChromeOS uses dlmalloc for managing the heap memory. Each time the program allocates memory, it will get a pointer back to the request memory region, and dlmalloc will put a small header of its own just before that memory region for its own purpose. If you ask for N bytes with malloc, dlmalloc will use ( header size + N ) and return the pointer to the N bytes the application asked for. Like this:

With a series of cleverly crafted HTTP requests of various sizes to the proxy, the attacker managed to create a hole of freed memory where he then reliably makes the c-ares allocated memory to end up. He knows exactly how the ChromeOS dlmalloc system works and its best-fit allocator, how big the c-ares malloc will be and thus where the overwritten 1 will end up. When the byte 1 is written after the memory, it is written into the header of the next memory chunk handled by dlmalloc:
![]()
The specific byte of that following dlmalloc header that it writes to, is used for flags and the lowest bits of size of that allocated chunk of memory.
Writing 1 to that byte clears 2 flags, sets one flag and clears the lowest bits of the chunk size. The important flag it sets is called prev_inuse and is used by dlmalloc to tell if it can merge adjacent areas on free. (so, if the value 1 simply had been a 2 instead, this flaw could not have been exploited this way!)
When the c-ares buffer that had overflowed is then freed again, dlmalloc gets fooled into consolidating that buffer with the subsequent one in memory (since it had toggled that bit) and thus the larger piece of assumed-to-be-free memory is partly still being in use. Open for manipulations!
![]()
This freed memory area whose end part is actually still being used opened up the play-field for more “fun”. With doing another creative HTTP request, that memory block would be allocated and used to store new data into.
The attacker managed to insert the right data in that further end of the data block, the one that was still used by another part of the program, mostly since the proxy pretty much allowed anything to get crammed into the request. The attacker managed to put his own code to execute in there and after a few more steps he ran whatever he wanted as root. Well, the user would have to get tricked into running a particular JavaScript but still…
I cannot even imagine how long time it must have taken to make this exploit and how much work and sweat that were spent. The report I read on this was 37 very detailed pages. And it was one of the best things I’ve read in a long while! When this goes public in the future, I hope at least parts of that description will become available for you as well.
No matter how limited or harmless a flaw may appear at a first glance, it can serve a malicious purpose and serve as one little step in a long chain of events to attack a system. And there are skilled people out there, ready to figure out all the necessary steps.
https://daniel.haxx.se/blog/2016/10/14/a-single-byte-write-opened-a-root-execution-exploit/
|
|
Christian Heilmann: We need JavaScript to fix the web |
TL;DR: JavaScript is too great an opportunity to build accessible, easy-to-use and flexible solutions for the web to not use it. It fills the gaps years of backwards-compatibility focus created. It helps with the problems of the now and the future that HTML and CSS alone can’t cover reliably. We shouldn’t blindly rely on it – we should own the responsibility to work around its flaky nature and reliability issues.

Right now, there is a lot of noise in our world about JavaScript, Progressive Enhancement and reliance on technology and processes. I’m in the middle of that. I have quite a few interviews with stakeholders in the pipeline and I’m working on some talks on the subject.
A lot of the chatter that’s happening right now seems to be circular:
Except, it isn’t. The web is in a terrible state and the average web site is slow, punishes our computers with slow running code and has no grace in trying to keep users interacting with it. Ads spy on us, scripts inject malware and it is taxing to find content in a mess of modals and overly complex interfaces.
It is high time we, the community that survived the first browser wars and made standards-driven development our goal, start facing facts. We failed to update our message of a usable and maintainable web to be relevant to the current market and a new generation of developers.
Our “best development practices” stem from a time when we had bad browsers on desktop computers. We had OK connectivity – it wasn’t fast, but it was at least reliable. We also created documents and enhanced them to become applications or get some interactivity later.
The holy trinity was and is:
That’s the message we like to tell. It is also largely a product of fiction. We defined these as best practices and followed them as much as we could, but a huge part of the web back then was done with WYSIWYG editors, CMS-driven or built with server-side frameworks. As such, the HTML was a mess, styles were an afterthought and JavaScript riddled with browser-sniffing or lots of document.write nasties. We pretended this wasn’t a problem and people who really care would never stoop down to creating terrible things like that.
There is no “the good old standards based web”. It was always a professional, craftsmanship view and ideal we tried to create. Fact is, we always hacked around issues with short-term solutions.
Browsers back then were not standards-aware and the browser wars raged. Having a different functionality than other browsers was a market advantage. This was bad for developers as we had to repeat all of our work for different browsers. The big skill was to know which browser messed up in which way. This was our clear target: to replace terrible web sites that only worked in IE6. The ones that were not maintainable unless you also had access to the CMS code or whatever language the framework was written in. We wanted to undo this mess by explaining what web standards are good for.
HTML describes linked documents with a few interactive elements. As quality oriented developers we started with an HTML document and we got a kick out of structuring it sensibly, adding just the right amount of CSS, adding some JavaScript to make it more interactive and release the thing. This was cool and is still very much possible. However, with the web being a main-stream medium these days, it isn’t quite how people work. We got used to things working in browsers differently, many of these patterns requiring JavaScript.
We got used to a higher level of interactivity as browser makers spend a lot of time ensuring compatibilty with another. We also have a few very obviously winning browsers and developers favouring them. Browsers are all great and open to feedback and there is no war among browser makers any longer. It is important to not block out users of older browsers, but there is no point in catering to them with extra work. Yes, you can go on the freeway with a car with broken indicators and no lights, but you are a danger to yourself and others. This is what surfing with old internet explorer is now.
HTML and CSS are gorgeous, beautiful in their simplicity and ensure that nobody on the web gets left out. Both technologies are very forgiving, allowing publishers of web content to make mistakes without making their readers suffer. This truth doesn’t change and – together with the beautiful simplicity that is a link – makes the web what it is. It is, however not good enough for today’s expectations of end users. It doesn’t matter if it is sturdy and can’t break it if is is boring or awkward to use.
Fact is that a lot of the amazing things of HTML aren’t as rosy when you look closer. One thing that opened my eyes was Monica Dinculescu’s talk “I love you input, but you’re letting me down”.
In it, Monica criticises the architecture and the implementation of the HTML input element. I was annoyed by that when I heard her hint at that earlier at Google IO. Surely this is wrong: INPUT is a beautiful thing. If you use input type range, end users of modern browsers get a slider, and older browsers a text box. Nobody is left out, it just gets better with better browsers. This is progressive enhancement at it’s best: built into the platform.
Except that the implementation of slider, number, URL and many of the other new input types that came with HTML5 is terrible. Monica shows some very obvious flaws in the most modern browsers that will not get fixed. Mostly, because nobody complained about them as developers use JavaScript solutions instead. So, yes, older browsers get a text box that works. But newer browsers get interfaces that disappoint or even make a simple task like entering a number impossible.
This is an inconvenient fact we need to own as something that needs to change. There is a lot of false information stating that functionality defined in the HTML5 standard can be used reliably and there is no need for JavaScript. This is simply not true, and, to a large degree, based on browser implementation. But, as Monica explains in detail, a lot of it is vaguely defined in the standard, was badly implemented in the beginning and now can’t be fixed in browsers as it would break a lot of live uses on the web. Every browser maker has to deal with this issue – we have a lot of terrible code on the web that still needs to work even if we’d love to fix the implementations.
There are other myths that keep cropping up. Adding ARIA to your HTML for example doesn’t automatically make your solutions accessible. Other than a few simple features like description any ARIA enhancement needs JavaScript to reach assistive technology.
The sturdy baseline we make HTML out to be has become much more fragile with the complexity we added when we moved with HTML5 from documents to apps. That doesn’t mean you should discard all semantic HTML and create everything with JavaScript. It does, however, neither mean that you can rely on HTML to magically solve usability and access issues for you.
Developers who start building for the web right now never knew what being offline on a Desktop feels like. They never got stuck with a JavaScript-dependent solution blocking them out. They’ve seen a fair share of JavaScript abuse, and they do encounter broken sites. But in most cases a reload fixes that. There is hardly any “your browser isn’t good enough” happening any more.
For better or worse, the success of the web became its curse. We were the cool “new media”. However, these days, we’re not cool. We’re like plumbing. When you’re in a fairly well-off country, you turn on the tap and water comes out. You don’t care about the plumbing or where it comes from. It is just there. Much like the web.
This is what we wanted, now we need to understand that our fascination with everything web is not shared by people who never knew a world without it.
It is time to move on and let the new generation of developers deal with the problems of now instead of us waving a finger and demanding a work ethic that always was a perfect scenario and a small part of how the market worked.
Technology is the only properly growing market out there and we are part of that. This means a lot of pressure is on this market to continuously grow. It means that we need to be seen as constantly innovating. If that makes sense or if it is necessary is irrelevant. We just need to be bigger, faster and more – all the time. Yes, this isn’t sustainable, but it makes money and that is – sadly enough – still the main goal of our world.
This means that when we talk about development, people are much more likely to listen to the framework that offers “quick apps without much code”. Developers are also more likely to get excited about anything that offers to build “small, independent solutions that can be mixed and matched to build huge applications that scale”.
Developers of the web these days aren’t asked to architect a clean, accessible and very well structured web document. If we are fair to ourselves, we were never asked to do this. We did it because we cared, and to make our lives easier. Standard driven development was there to protect us from reinventing the wheel. However, these days, this is exactly what is expected of a cool new company and developers. We live in a world of components. We are continuously asked to build something fast that others can reuse in any product. That way you can have 10 developers work on a product in parallel and you can remove and add functionality as it is needed.
This is how we got solutions like “Object Oriented CSS“. The Cascade is a beautiful part of CSS that allows you to write a few lines that get applied to thousands of documents without you needing to repeat your definitions. This is working against the concept of reusable, small components that don’t inherit any look and feel from their parent container. Our use case changed, and the standards didn’t deliver the functionality we needed.
Our world has changed drastically. We now live in a world where Desktop is not as important. Everything points to the next users of the web being on mobiles. This doesn’t mean Desktops are irrelevant and our solutions for that form factor bad.
It means that our “best practices” don’t solve the current issues. Best practices aren’t defined. They are found by trial and error. This is how we got where we are now with crazy CSS hacks like resets, browser filters (midpass using voice CSS anyone?) and many other – now considered terrible – ideas.
We need to find solutions for bad or no connectivity on fairly capable browsers on interfaces that aren’t keyboard driven. We need solutions for small screens and interactivity ready for big fingers or voice control.
Yes, the most hard core scenarios of this world mean you can’t rely on client side scripting or a lot of storage space. Proxy browsers and battery or data saving settings of some browsers interfere with what we can do on the client. On the whole though what we deal with is a pretty capable computer (surely much better than the ones we had when we defined our best web practices) on a small screen device with dubious, non-reliable or even non-existing connectivity.
Now, JavaScript gives us a lot of great features to cater for this world. We can use ServiceWorker to offer offline functionality, we can store content in a reliable manner on the device by using IndexedDB instead of relying on a browser cache and we have the DOM and events to enhance HTML interfaces to become touch enabled without delays. More importantly, we have a way to demand functionality on the fly and test if it was successful before applying it. We have a very mighty “if” statement that allows us to react to success and failure cases. Developer tools give us full insight into what happened, including slow performance. Yes, this is a much more complex starting point than writing an HTML document and adding some CSS. But this is why we are paid as professionals. Everyone is invited to contribute to the web. Professionals who expect to be paid for creating web content need to do more.
We can create interfaces that are great to use, intuitive and accessible if we use some semantic HTML, CSS and JavaScript. Instead we keep harping on about using HTML for everything, CSS if we can and JavaScript if we must. Many “CSS only” solutions have dubious accessibility features and expect a lot of knowledge of CSS quirks from the maintainer. Enough already. Great solutions are not limited to one of the web technologies and demanding expert care. They are a mix of all of them, catered to the needs of the users.
If we see JavaScript as a given and we constantly remind ourselves about its non-forgiving nature we have a new baseline to build amazing solutions for the current and future web. The main thing we have to understand is that it is our responsibility to make our products load fast, work smoothly, and to be accessible to those with a sensible environment. We can not rely on the sturdiness of the web of old to take that responsibility away from us. We need to own it and move the web forward.
This doesn’t mean we need to blindly use JavaScript and frameworks to deliver our products. There is space for many different solutions and approaches. It does mean, however, that we shouldn’t limit us to what made sense over a decade ago. New form factors need new thinking, and I for one trust those rebelling against the best practices of old to find good solutions much like we defined our best practices based on stalwart and short-term solutions of those before us.
JavaScript abuse is rampant. It is the main reason for security issues on the web and terrible performance of the average web site. We shove functionality and ads in the face of end users in the hope of keeping them. Instead we should use using browser and hardware functionality to deliver a great experience. With JavaScript I can react to all kind of events and properties of the computer my product is consumed in. Without it, I need to hope that functionality exists. Only by owning the fact that JavaScript is a given we can start making the clogged up web better. It is time to clean up the current web instead of demanding the “good old web” that never really existed.
Photo credit: John Loo via Visual hunt / CC BY
https://www.christianheilmann.com/2016/10/14/we-need-javascript-to-fix-the-web/
|
|
Wil Clouser: Test Pilot 2016 Q4 OKRs |
The Test Pilot 2016 Q4 OKRs are published. Primarily we'll be focused on continued growth of users (our overall 2016 goal). We deprioritized localization last quarter and over-rotated on publishing experiments by launching four when we were only aiming for one. This quarter we'll turn that knob back down (we're aiming for two new experiments) and get localization done.
We also failed to graduate any experiments last quarter -- arguably the most important part of our entire process since it includes drawing conclusions and publishing our results. This quarter we'll graduate three experiments from Test Pilot, publish our findings so we can improve Firefox, and clear out space in Test Pilot for the next big ideas.
http://micropipes.com/blog//2016/10/14/test-pilot-2016-q4-okrs/
|
|
Nicholas Nethercote: How to speed up the Rust compiler |
Rust is a great language, and Mozilla plans to use it extensively in Firefox. However, the Rust compiler (rustc) is quite slow and compile times are a pain point for many Rust users. Recently I’ve been working on improving that. This post covers how I’ve done this, and should be of interest to anybody else who wants to help speed up the Rust compiler. Although I’ve done all this work on Linux it should be mostly applicable to other platforms as well.
The first step is to get the rustc code. First, I fork the main Rust repository on GitHub. Then I make two local clones: a base clone that I won’t modify, which serves as a stable comparison point (rust0), and a second clone where I make my modifications (rust1). I use commands something like this:
user=nnethercote
for r in rust0 rust1 ; do
  cd ~/moz
  git clone https://github.com/$user/rust $r
  cd $r
  git remote add upstream https://github.com/rust-lang/rust
  git remote set-url origin git@github.com:$user/rust
done
Within the two repositories, I first configure:
./configure --enable-optimize --enable-debuginfo
I configure with optimizations enabled because that matches release versions of rustc. And I configure with debug info enabled so that I get good information from profilers.
Then I build:
RUSTFLAGS='-Ccodegen-units=8' make -j8
The -Ccodegen-units=8/-j8 combination speeds up the build process significantly; I’m taking it on faith that it doesn’t affecting the accuracy of subsequent profiling information.
That does a full build, which does the following:
It can be mind-bending to grok all the stages, especially with regards to how libraries work. (One notable example: the stage1 compiler uses the system allocator, but the stage2 compiler uses jemalloc.) I’ve found that the stage1 and stage2 compilers have similar performance. Therefore, I mostly measure the stage1 compiler because it’s much faster to just build the stage1 compiler, which I do with the following command.
RUSTFLAGS='-Ccodegen-units=8' make -j8 rustc-stage1
Building the compiler takes a while, which isn’t surprising. What is more surprising is that rebuilding the compiler after a small change also takes a while. That’s because a lot of code gets recompiled after any change. There are two reasons for this.
Incremental compilation should greatly improve the dependency situation, but it’s still in an experimental state and I haven’t tried it yet.
To run all the tests I do this (after a full build):
ulimit -c 0 && make check
The checking aborts if you don’t do the ulimit, because the tests produces lots of core files and it doesn’t want to swamp your disk.
The build system is complex, with lots of options. This command gives a nice overview of some common invocations:
make tips
The next step is to do some basic profiling. I like to be careful about which rustc I am invoking at any time, especially if there’s a system-wide version installed, so I avoid relying on PATH and instead define some environment variables like this:
export RUSTC01="$HOME/moz/rust0/x86_64-unknown-linux-gnu/stage1/bin/rustc"
export RUSTC02="$HOME/moz/rust0/x86_64-unknown-linux-gnu/stage2/bin/rustc"
export RUSTC11="$HOME/moz/rust1/x86_64-unknown-linux-gnu/stage1/bin/rustc"
export RUSTC12="$HOME/moz/rust1/x86_64-unknown-linux-gnu/stage2/bin/rustc"
In the examples that follow I will use $RUSTC01 as the version of rustc that I invoke.
rustc has the ability to produce some basic stats about the time and memory used by each compiler pass. It is enabled with the -Ztime-passes flag. If you are invoking rustc directly you’d do it like this:
$RUSTC01 -Ztime-passes a.rs
If you are building with Cargo you can instead do this:
RUSTC=$RUSTC01 cargo rustc -- -Ztime-passes
The RUSTC= part tells Cargo you want to use a non-default rustc, and the part after the -- is flags that will be passed to rustc when it builds the final crate. (A bit weird, but useful.)
Here is some sample output from -Ztime-passes:
time: 0.056; rss: 49MB parsing
time: 0.000; rss: 49MB recursion limit
time: 0.000; rss: 49MB crate injection
time: 0.000; rss: 49MB plugin loading
time: 0.000; rss: 49MB plugin registration
time: 0.103; rss: 87MB expansion
time: 0.000; rss: 87MB maybe building test harness
time: 0.002; rss: 87MB maybe creating a macro crate
time: 0.000; rss: 87MB checking for inline asm in case the target doesn't support it
time: 0.005; rss: 87MB complete gated feature checking
time: 0.008; rss: 87MB early lint checks
time: 0.003; rss: 87MB AST validation
time: 0.026; rss: 90MB name resolution
time: 0.019; rss: 103MB lowering ast -> hir
time: 0.004; rss: 105MB indexing hir
time: 0.003; rss: 105MB attribute checking
time: 0.003; rss: 105MB language item collection
time: 0.004; rss: 105MB lifetime resolution
time: 0.000; rss: 105MB looking for entry point
time: 0.000; rss: 105MB looking for plugin registrar
time: 0.015; rss: 109MB region resolution
time: 0.002; rss: 109MB loop checking
time: 0.002; rss: 109MB static item recursion checking
time: 0.060; rss: 109MB compute_incremental_hashes_map
time: 0.000; rss: 109MB load_dep_graph
time: 0.021; rss: 109MB type collecting
time: 0.000; rss: 109MB variance inference
time: 0.038; rss: 113MB coherence checking
time: 0.126; rss: 114MB wf checking
time: 0.219; rss: 118MB item-types checking
time: 1.158; rss: 125MB item-bodies checking
time: 0.000; rss: 125MB drop-impl checking
time: 0.092; rss: 127MB const checking
time: 0.015; rss: 127MB privacy checking
time: 0.002; rss: 127MB stability index
time: 0.011; rss: 127MB intrinsic checking
time: 0.007; rss: 127MB effect checking
time: 0.027; rss: 127MB match checking
time: 0.014; rss: 127MB liveness checking
time: 0.082; rss: 127MB rvalue checking
time: 0.145; rss: 161MB MIR dump
 time: 0.015; rss: 161MB SimplifyCfg
 time: 0.033; rss: 161MB QualifyAndPromoteConstants
 time: 0.034; rss: 161MB TypeckMir
 time: 0.001; rss: 161MB SimplifyBranches
 time: 0.006; rss: 161MB SimplifyCfg
time: 0.089; rss: 161MB MIR passes
time: 0.202; rss: 161MB borrow checking
time: 0.005; rss: 161MB reachability checking
time: 0.012; rss: 161MB death checking
time: 0.014; rss: 162MB stability checking
time: 0.000; rss: 162MB unused lib feature checking
time: 0.101; rss: 162MB lint checking
time: 0.000; rss: 162MB resolving dependency formats
 time: 0.001; rss: 162MB NoLandingPads
 time: 0.007; rss: 162MB SimplifyCfg
 time: 0.017; rss: 162MB EraseRegions
 time: 0.004; rss: 162MB AddCallGuards
 time: 0.126; rss: 164MB ElaborateDrops
 time: 0.001; rss: 164MB NoLandingPads
 time: 0.012; rss: 164MB SimplifyCfg
 time: 0.008; rss: 164MB InstCombine
 time: 0.003; rss: 164MB Deaggregator
 time: 0.001; rss: 164MB CopyPropagation
 time: 0.003; rss: 164MB AddCallGuards
 time: 0.001; rss: 164MB PreTrans
time: 0.182; rss: 164MB Prepare MIR codegen passes
 time: 0.081; rss: 167MB write metadata
 time: 0.590; rss: 177MB translation item collection
 time: 0.034; rss: 180MB codegen unit partitioning
 time: 0.032; rss: 300MB internalize symbols
time: 3.491; rss: 300MB translation
time: 0.000; rss: 300MB assert dep graph
time: 0.000; rss: 300MB serialize dep graph
 time: 0.216; rss: 292MB llvm function passes [0]
 time: 0.103; rss: 292MB llvm module passes [0]
 time: 4.497; rss: 308MB codegen passes [0]
 time: 0.004; rss: 308MB codegen passes [0]
time: 5.185; rss: 308MB LLVM passes
time: 0.000; rss: 308MB serialize work products
time: 0.257; rss: 297MB linking
As far as I can tell, the indented passes are sub-passes, and the parent pass is the first non-indented pass afterwards.
The -Ztime-passes flag gives a good overview, but you really need a profiling tool that gives finer-grained information to get far. I’ve done most of my profiling with two Valgrind tools, Cachegrind and DHAT. I invoke Cachegrind like this:
valgrind \
 --tool=cachegrind --cache-sim=no --branch-sim=yes \
 --cachegrind-out-file=$OUTFILE $RUSTC01 ...
where $OUTFILE specifies an output filename. I find the instruction counts measured by Cachegrind to be highly useful; the branch simulation results are occasionally useful, and the cache simulation results are almost never useful.
The Cachegrind output looks like this:
--------------------------------------------------------------------------------
            Ir
--------------------------------------------------------------------------------
22,153,170,953 PROGRAM TOTALS

--------------------------------------------------------------------------------
         Ir file:function
--------------------------------------------------------------------------------
923,519,467 /build/glibc-GKVZIf/glibc-2.23/malloc/malloc.c:_int_malloc
879,700,120 /home/njn/moz/rust0/src/rt/miniz.c:tdefl_compress
629,196,933 /build/glibc-GKVZIf/glibc-2.23/malloc/malloc.c:_int_free
394,687,991 ???:???
379,869,259 /home/njn/moz/rust0/src/libserialize/leb128.rs:serialize::leb128::read_unsigned_leb128
376,921,973 /build/glibc-GKVZIf/glibc-2.23/malloc/malloc.c:malloc
263,083,755 /build/glibc-GKVZIf/glibc-2.23/string/::/sysdeps/x86_64/multiarch/memcpy-avx-unaligned.S:__memcpy_avx_unaligned
257,219,281 /home/njn/moz/rust0/src/libserialize/opaque.rs: as serialize::serialize::Decoder>::read_usize
217,838,379 /build/glibc-GKVZIf/glibc-2.23/malloc/malloc.c:free
217,006,132 /home/njn/moz/rust0/src/librustc_back/sha2.rs:rustc_back::sha2::Engine256State::process_block
211,098,567 ???:llvm::SelectionDAG::Combine(llvm::CombineLevel, llvm::AAResults&, llvm::CodeGenOpt::Level)
185,630,213 /home/njn/moz/rust0/src/libcore/hash/sip.rs:::write
171,360,754 /home/njn/moz/rust0/src/librustc_data_structures/fnv.rs: as core::hash::Hash>::hash
150,026,054 ???:llvm::SelectionDAGISel::SelectCodeCommon(llvm::SDNode*, unsigned char const*, unsigned int)
Here “Ir” is short for “I-cache reads”, which corresponds to the number of instructions executed. Cachegrind also gives line-by-line annotations of the source code.
The Cachegrind results indicate that malloc and free are usually the two hottest functions in the compiler. So I also use DHAT, which is a malloc profiler that tells you exactly where all your malloc calls are coming from. I invoke DHAT like this:
/home/njn/grind/ws3/vg-in-place \
 --tool=exp-dhat --show-top-n=1000 --num-callers=4 \
 --sort-by=tot-blocks-allocd $RUSTC01 ... 2> $OUTFILE
I sometimes also use --sort-by=tot-bytes-allocd. DHAT’s output looks like this:
==16425== -------------------- 1 of 1000 --------------------
==16425== max-live: 30,240 in 378 blocks
==16425== tot-alloc: 20,866,160 in 260,827 blocks (avg size 80.00)
==16425== deaths: 260,827, at avg age 113,438 (0.00% of prog lifetime)
==16425== acc-ratios: 0.74 rd, 1.00 wr (15,498,021 b-read, 20,866,160 b-written)
==16425== at 0x4C2BFA6: malloc (vg_replace_malloc.c:299)
==16425== by 0x5AD392B:  as serialize::serialize::Decodable>::decode (heap.rs:59)
==16425== by 0x5AD4456:  as core::iter::iterator::Iterator>::next (serialize.rs:201)
==16425== by 0x5AE2A52: rustc_metadata::decoder::::get_attributes (vec.rs:1556)
==16425==
==16425== -------------------- 2 of 1000 --------------------
==16425== max-live: 1,360 in 17 blocks
==16425== tot-alloc: 10,378,160 in 129,727 blocks (avg size 80.00)
==16425== deaths: 129,727, at avg age 11,622 (0.00% of prog lifetime)
==16425== acc-ratios: 0.47 rd, 0.92 wr (4,929,626 b-read, 9,599,798 b-written)
==16425== at 0x4C2BFA6: malloc (vg_replace_malloc.c:299)
==16425== by 0x881136A:  as core::clone::Clone>::clone (heap.rs:59)
==16425== by 0x88233A7: syntax::ext::tt::macro_parser::parse (vec.rs:1105)
==16425== by 0x8812E66: syntax::tokenstream::TokenTree::parse (tokenstream.rs:230)
The “deaths” value here indicate the total number of calls to malloc for each call stack, which is usually the metric of most interest. The “acc-ratios” value can also be interesting, especially if the “rd” value is 0.00, because that indicates the allocated blocks are never read. (See below for example of problems that I found this way.)
For both profilers I also pipe $OUTFILE through eddyb’s rustfilt.sh script which demangles ugly Rust symbols like this:
_$LT$serialize..opaque..Decoder$LT$$u27$a$GT$$u20$as$u20$serialize..serialize..Decoder$GT$::read_usize::h87863ec7f9234810
to something much nicer, like this:
as serialize::serialize::Decoder>::read_usize
For programs that use Cargo, sometimes it’s useful to know the exact rustc invocations that Cargo uses. Find out with either of these commands:
RUSTC=$RUSTC01 cargo build -v
RUSTC=$RUSTC01 cargo rust -v
I also have done a decent amount of ad hoc println profiling, where I insert println! calls in hot parts of the code and then I use a script to post-process them. This can be very useful when I want to know exactly how many times particular code paths are hit.
I’ve also tried perf. It works, but I’ve never established much of a rapport with it. YMMV. In general, any profiler that works with C or C++ code should also work with Rust code.
Once you know how you’re going to profile you need some good workloads. You could use the compiler itself, but it’s big and complicated and reasoning about the various stages can be confusing, so I have avoided that myself.
Instead, I have focused entirely on rustc-benchmarks, a pre-existing rustc benchmark suite. It contains 13 benchmarks of various sizes. It has been used to track rustc’s performance at perf.rust-lang.org for some time, but it wasn’t easy to use locally until I wrote a script for that purpose. I invoke it something like this:
./compare.py \
  /home/njn/moz/rust0/x86_64-unknown-linux-gnu/stage1/bin/rustc \
  /home/njn/moz/rust1/x86_64-unknown-linux-gnu/stage1/bin/rustc
It compares the two given compilers, doing debug builds, on the benchmarks See the next section for example output. If you want to run a subset of the benchmarks you can specify them as additional arguments.
Each benchmark in rustc-benchmarks has a makefile with three targets. See the README for details on these targets, which can be helpful.
Here are the results if I compare the following two versions of rustc with compare.py.
futures-rs-test  5.028s vs  4.433s --> 1.134x faster (variance: 1.020x, 1.030x)
helloworld       0.283s vs  0.235s --> 1.202x faster (variance: 1.012x, 1.025x)
html5ever-2016-  6.293s vs  5.652s --> 1.113x faster (variance: 1.011x, 1.008x)
hyper.0.5.0      6.182s vs  5.039s --> 1.227x faster (variance: 1.002x, 1.018x)
inflate-0.1.0    5.168s vs  4.935s --> 1.047x faster (variance: 1.001x, 1.002x)
issue-32062-equ  0.457s vs  0.347s --> 1.316x faster (variance: 1.010x, 1.007x)
issue-32278-big  2.046s vs  1.706s --> 1.199x faster (variance: 1.003x, 1.007x)
jld-day15-parse  1.793s vs  1.538s --> 1.166x faster (variance: 1.059x, 1.020x)
piston-image-0. 13.871s vs 11.885s --> 1.167x faster (variance: 1.005x, 1.005x)
regex.0.1.30     2.937s vs  2.516s --> 1.167x faster (variance: 1.010x, 1.002x)
rust-encoding-0  2.414s vs  2.078s --> 1.162x faster (variance: 1.006x, 1.005x)
syntex-0.42.2   36.526s vs 32.373s --> 1.128x faster (variance: 1.003x, 1.004x)
syntex-0.42.2-i 21.500s vs 17.916s --> 1.200x faster (variance: 1.007x, 1.013x)
Not all of the improvement is due to my changes, but I have managed a few nice wins, including the following.
#36592: There is an arena allocator called TypedArena. rustc creates many of these, mostly short-lived. On creation, each arena would allocate a 4096 byte chunk, in preparation for the first arena allocation request. But DHAT’s output showed me that the vast majority of arenas never received such a request! So I made TypedArena lazy — the first chunk is now only allocated when necessary. This reduced the number of calls to malloc greatly, which sped up compilation of several rustc-benchmarks by 2–6%.
#36734: This one was similar. Rust’s HashMap implementation is lazy — it doesn’t allocate any memory for elements until the first one is inserted. This is a good thing because it’s surprisingly common in large programs to create HashMaps that are never used. However, Rust’s HashSet implementation (which is just a layer on top of the HashMap) didn’t have this property, and guess what? rustc also creates large numbers of HashSets that are never used. (Again, DHAT’s output made this obvious.) So I fixed that, which sped up compilation of several rustc-benchmarks by 1–4%. Even better, because this change is to Rust’s stdlib, rather than rustc itself, it will speed up any program that creates HashSets without using them.
#36917: This one involved avoiding some useless data structure manipulation when a particular table was empty. Again, DHAT pointed out a table that was created but never read, which was the clue I needed to identify this improvement. This sped up two benchmarks by 16% and a couple of others by 3–5%.
#37064: This one changed a hot function in serialization code to return a Cow
Profiles indicate that the following parts of the compiler account for a lot of its runtime.
tdefl_compress.) There is an issue open about this.A lot of programs have broadly similar profiles, but occasionally you get an odd one that stresses a different part of the compiler. For example, in rustc-benchmarks, inflate-0.1.0 is dominated by operations involving the (delighfully named) ObligationsForest (see #36993), and html5ever-2016-08-25 is dominated by what I think is macro processing. So it’s worth profiling the compiler on new codebases.
I’m still a newcomer to Rust development. Although I’ve had lots of help on the #rustc IRC channel — big thanks to eddyb and simulacrum in particular — there may be things I am doing wrong or sub-optimally. Nonetheless, I hope this is a useful starting point for newcomers who want to speed up the Rust compiler.
https://blog.mozilla.org/nnethercote/2016/10/14/how-to-speed-up-the-rust-compiler/
|
|
Mozilla Addons Blog: Add-on Compatibility for Firefox 51 |
Firefox 51 will be released on January 24th. Note that the scheduled release on December 13th is a point release, not a major release, hence the much longer cycle. Here’s the list of changes that went into this version that can affect add-on compatibility. There is more information available in Firefox 51 for Developers, so you should also give it a look.
BrowserOpenNewTabOrWindow function.setTimeout after alert. This changes the behavior of the onButtonClick function to make it async.mozVisibilityState and mozHidden.strict_min_version in a WebExtension manifest.json). Minimum versions should always be specific versions, rather than a mask.setAndFetchFaviconForPage and replaceFaviconDataFromDataURL. The principal should generally be passed as an argument.mimeTypes.rdf.Actor/FrontClass. While both of these still work for add-ons, they should be considered as deprecated.Let me know in the comments if there’s anything missing or incorrect on these lists. If your add-on breaks on Firefox 51, I’d like to know.
The automatic compatibility validation and upgrade for add-ons on AMO will happen in a few weeks, so keep an eye on your email if you have an add-on listed on our site with its compatibility set to Firefox 50.
https://blog.mozilla.org/addons/2016/10/13/compatibility-for-firefox-51/
|
|
The Mozilla Blog: Bringing the Power of the Internet to the Next Billion and Beyond |
Announcing Mozilla’s Equal Rating Innovation Challenge, a $250,000 contest including expert mentorship to spark new ways to connect everyone to the Internet.
At Mozilla, we believe the Internet is most powerful when anyone – regardless of gender, income, or geography – can participate equally. However the digital divide remains a clear and persistent reality. Today more than 4 billion people are still not online, according to the World Economic Forum. That is greater than 55% of the global population. Some, who live in poor or rural areas, lack the infrastructure. Fast wired and wireless connectivity only reaches 30% of rural areas. Other people don’t connect because they don’t believe there is enough relevant digital content in their language. Women are also less likely to access and use the Internet; only 37% access the Internet versus 59% of men, according to surveys by the World Wide Web Foundation.
Access alone, however, is not sufficient. Pre-selected content and walled gardens powered by specific providers subvert the participatory and democratic nature of the Internet that makes it such a powerful platform. Mitchell Baker coined the term equal rating in a 2015 blog post. Mozilla successfully took part in shaping pro-net neutrality legislation in the US, Europe and India. Today, Mozilla’s Open Innovation Team wants to inject practical, action-oriented, new thinking into these efforts.
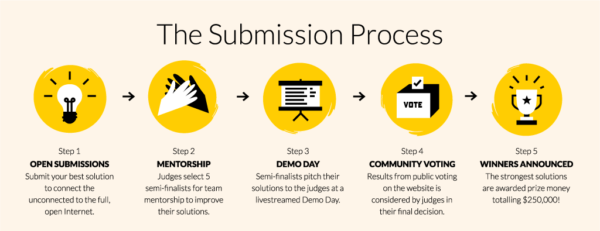
This is why we are very excited to launch our global Equal Rating Innovation Challenge. This challenge is designed to spur innovations for bringing the members of the Next Billion online. The Equal Rating Innovation Challenge is focused on identifying creative new solutions to connect the unconnected. These solutions may range from consumer products and novel mobile services to new business models and infrastructure proposals. Mozilla will award US$250,000 in funding and provide expert mentorship to bring these solutions to the market.
![]() We seek to engage entrepreneurs, designers, researchers, and innovators all over the world to propose creative, engaging and scalable ideas that cultivate digital literacy and provide affordable access to the full diversity of the open Internet. In particular, we welcome proposals that build on local knowledge and expertise. Our aim is to entertain applications from all over the globe.
We seek to engage entrepreneurs, designers, researchers, and innovators all over the world to propose creative, engaging and scalable ideas that cultivate digital literacy and provide affordable access to the full diversity of the open Internet. In particular, we welcome proposals that build on local knowledge and expertise. Our aim is to entertain applications from all over the globe.
The US$250,000 in prize monies will be split in three categories:
This level of funding may be everything a team needs to go to market with a consumer product, or it may provide enough support to unlock further funding for an infrastructure project.
The official submission period will run from 1 November to 6 January. All submissions will be judged by a group of external experts by mid January. The selected semifinalists will receive mentorship for their projects before they demo their ideas in early March. The winners will be announced at the end of March 2017.
We have also launched www.equalrating.com, a website offering educational content and background information to support the challenge. On the site, you will find the 3 key frameworks that may be useful for building understanding of the different aspects of this topic. You can read important statistics that humanize this issue, and see how connectivity influences gender dynamics, education, economics, and a myriad of other social issues. The reports section provides further depth to the different positions of the current debate. In the coming weeks, we will also stream a series of webinars to further inform potential applicants about the challenge details. We hope these webinars also provide opportunities for dialogue and questions.
Connecting the unconnected is one of the greatest challenges of our time. No one organization or effort can tackle it alone. Spread the word. Submit your ideas to build innovative and scalable ways to bring Internet access to the Next Billion – and the other billions, as well. Please join us in addressing this grand challenge.
Further information: www.equalrating.com
Contact: equalrating@mozilla.com
|
|
Mozilla Open Innovation Team: Bringing the Power of the Internet to the Next Billion and Beyond |
Announcing Mozilla’s Equal Rating Innovation Challenge, a $250,000 contest including expert mentorship to spark new ways to connect everyone to the Internet.
At Mozilla, we believe the Internet is most powerful when anyone — regardless of gender, income, or geography — can participate equally. However the digital divide remains a clear and persistent reality. Today more than 4 billion people are still not online, according to the World Economic Forum. That is greater than 55% of the global population. Some, who live in poor or rural areas, lack the infrastructure. Fast wired and wireless connectivity only reaches 30% of rural areas. Other people don’t connect because they don’t believe there is enough relevant digital content in their language. Women are also less likely to access and use the Internet; only 37% access the Internet versus 59% of men, according to surveys by the World Wide Web Foundation.
Access alone, however, is not sufficient. Pre-selected content and walled gardens powered by specific providers subvert the participatory and democratic nature of the Internet that makes it such a powerful platform. Mitchell Baker coined the term equal rating in a 2015 blog post. Mozilla successfully took part in shaping pro-net neutrality legislation in the US, Europe and India. Today, Mozilla’s Open Innovation Team wants to inject practical, action-oriented, new thinking into these efforts.
This is why we are very excited to launch our global Equal Rating Innovation Challenge. This challenge is designed to spur innovations for bringing the members of the Next Billion online. The Equal Rating Innovation Challenge is focused on identifying creative new solutions to connect the unconnected. These solutions may range from consumer products and novel mobile services to new business models and infrastructure proposals. Mozilla will award US$250,000 in funding and provide expert mentorship to bring these solutions to the market.

We seek to engage entrepreneurs, designers, researchers, and innovators all over the world to propose creative, engaging and scalable ideas that cultivate digital literacy and provide affordable access to the full diversity of the open Internet. In particular, we welcome proposals that build on local knowledge and expertise. Our aim is to entertain applications from all over the globe.
The US$250,000 in prize monies will be split in three categories:
This level of funding may be everything a team needs to go to market with a consumer product, or it may provide enough support to unlock further funding for an infrastructure project.
The official submission period will run from 1 November to 6 January. All submissions will be judged by a group of external experts by mid January. The selected semifinalists will receive mentorship for their projects before they demo their ideas in early March. The winners will be announced at the end of March 2017.

We have also launched www.equalrating.com, a website offering educational content and background information to support the challenge. On the site, you will find the 3 key frameworks that may be useful for building understanding of the different aspects of this topic. You can read important statistics that humanize this issue, and see how connectivity influences gender dynamics, education, economics, and a myriad of other social issues. The reports section provides further depth to the different positions of the current debate. In the coming weeks, we will also stream a series of webinars to further inform potential applicants about the challenge details. We hope these webinars also provide opportunities for dialogue and questions.
Connecting the unconnected is one of the greatest challenges of our time. No one organization or effort can tackle it alone. Spread the word. Submit your ideas to build innovative and scalable ways to bring Internet access to the Next Billion — and the other billions, as well. Please join us in addressing this grand challenge.
Further information: www.equalrating.com
Contact: equalrating@mozilla.com
Bringing the Power of the Internet to the Next Billion and Beyond was originally published in Mozilla Open Innovation on Medium, where people are continuing the conversation by highlighting and responding to this story.
|
|
Aki Sasaki: scriptworker 0.8.0 |
Tl;dr: I just shipped scriptworker 0.8.0 (changelog) (RTD) (github) (pypi).
This is a non-backwards-compatible release.
By design, taskcluster workers are very flexible and user-input-driven. This allows us to put CI task logic in-tree, which means developers can modify that logic as part of a try push or a code commit. This allows for a smoother, self-serve CI workflow that can ride the trains like any other change.
However, a secure release workflow requires certain tasks to be less permissive and more auditable. If the logic behind code signing or pushing updates to our users is purely in-tree, and the related checks and balances are also in-tree, the possibility of a malicious or accidental change being pushed live increases.
Enter scriptworker. Scriptworker is a limited-purpose taskcluster worker type: each instance can only perform one type of task, and validates its restricted inputs before launching any task logic. The scriptworker instances are maintained by Release Engineering, rather than the Taskcluster team. This separates roles between teams, which limits damage should any one user's credentials become compromised.
The past several releases have included changes involving the chain of trust. Scriptworker 0.8.0 is the first release that enables gpg key management and chain of trust signing.
An upcoming scriptworker release will enable upstream chain of trust validation. Once enabled, scriptworker will fail fast on any task or graph that doesn't pass the validation tests.
|
|
Air Mozilla: Connected Devices Weekly Program Update, 13 Oct 2016 |
 Weekly project updates from the Mozilla Connected Devices team.
https://air.mozilla.org/connected-devices-weekly-program-update-20161013/
|
|
Air Mozilla: Reps Weekly Meeting Oct. 13, 2016 |
 This is a weekly call with some of the Reps to discuss all matters about/affecting Reps and invite Reps to share their work with everyone.
|
|
Air Mozilla: Mozilla Learning, Science Community Call |
The presence and participation of women in STEM is on the rise thanks to the efforts of many across the globe, but still has many...
https://air.mozilla.org/mozilla-learning-science-community-call-2016-10-13/
|
|
Chris McDonald: Describing and Debugging Change Over Time in a System |
So, Aria Stewart tweeted two questions and statement the other day:
Programmers: can you describe change over time in a system? How completely?
Practice this.
— Aria Stewart (@aredridel) October 10, 2016
I wanted to discuss this idea as it pertains to debugging and strategies I’ve been employing more often lately. But lets examine the topic at face value first, describing change over time in a system. The abstract “system” is where a lot of the depth in this question comes from. It could be talking about the computer you’re on, the code base you work in, data moving through your application, an organization of people, many things fall into a system of some sort, and time acts upon them all. I’m going to choose the data moving through a system as the primary topic, but also talk about code bases over time.
Another part of the question that keeps it quite open is the lack of “why”, “what”, or “how” in it. This means we could discuss why the data needs to be transformed in various ways, why we added a feature or change some code, why an organization is investing in writing software at all. We could talk about what change at each step in a data pipeline, what changes have happened in a given commit, or what goals were accomplished each month by some folks. Or, the topic could be how a compiler changes the data as it passes through, how a programmer sets about making changes to a code base, or how an organization made its decisions to go in the directions it did. All quite valid and this is but a fraction of the depth in this simple question.
Let’s talk about systems a bit. At work, we have a number of services talking via a messaging system and a relational database. The current buzz phrase for this is “micro services” but we also called them “service oriented architectures” in the past. My previous job, I worked in a much smaller system that had many components for gathering data, as well as a few components for processing that data and sending it back to the servers. Both of these systems shared common attributes which most other systems also must cope with: events that provide data to be processed happen in functionally random order, that data is fed into processors who then stage data to be consumed by other parts of the system.
When problems arise in systems like these, it can be difficult to tell what piece is causing disruption. The point where the data changes from healthy to problematic may be a few steps removed from the layer that the problem is detected in. Also, sometimes the data is good enough to only cause subtle problems. At the start of the investigation, all you might know is something bad happened in the past. It is especially at these points when we need the description of the change that should happen to our data over time, hopefully with as much detail as possible.
The more snarky among us will point out the source code is what is running so why would you need some other description? The problem often isn’t that a given developer can’t understand code as they read it, though that may be the case. Rather, I find the problem is that code is meant to handle so many different cases and scenarios that the exact slice that I care about is often hard to track. Luckily our brains are build up these mental models that we can use to traverse our code, eliminating blocks of code because we intuitively “know” the problem couldn’t be in them, because we have an idea of how our code should work. Unfortunately, it is often at the mental model part where problems arise. The same tricks we use to read faster and then miss errors in our own writing are what can cause problems when understanding why a system is working in some way we didn’t expect.
Mental models are often incomplete due to using libraries, having multiple developers on a project, and the ravages of time clawing away at our memory. In some cases the mental model is just wrong. You may have intended to make a change but forgot to actually do it, maybe you read some documentation in a different way than intended, possibly you made a mistake while writing the code such as a copy/paste error or off by 1 in a loop. It doesn’t really matter the source of the flaw though, because when we’re hunting a bug. The goal is to find what the flaw in both the code and the mental model are so it can be corrected, then we can try to identify why the model got out of wack in the first place.
Can we describe change in a system over time? Probably to some reasonable degree of accuracy, but likely not completely. How does all of this tie into debugging? The strategy I’ve been practicing when I hit these situations is particularly geared around the idea that my mental model and the code are not in agreement. I shut off anything that might interrupt a deep focus time such as my monitors and phone, then gather a stack of paper and a pen. I write down the reproduction steps at whatever level of detail they were given to me to use as a guide in the next process.
I then write out every single step along the path that the data will take as it appears in my mental model, preferably in order. This often means a number of arrows as I put in steps I forgot. Because I know the shape data and the reproduction steps, I can make assumptions like “we have an active connection to the database.” Assumptions are okay at this point, I’m just building up a vertical slice of the system and how it affects a single type of data. Once I’ve gotten a complete list of event on the path, I then start the coding part. I go through and add log lines that line up with list I made, or improve them when I see there is already some logging at a point. Running the code periodically to make sure my new code hasn’t caused any issues and that my mental model still holds true.
The goal of this exercise isn’t necessarily to bring the code base into alignment with my mental model, because my mental model may be wrong for a reason. But because there is a bug, so rarely am I just fixing my mental model, unless of course I discover the root cause and have to just say “working as intended.” As I go through, I make notes on my paper mental model where things vary, often forgotten steps make their way in now. Eventually, I find some step that doesn’t match up, at that point I probably know how to solve the bug, but usually I keep going, correcting the bug in the code, but continuing to analyze the system against my mental model.
I always keep going until I exhaust the steps in my mental model for a few reasons. First, since there was at least one major flaw in my mental model, there could be more, especially if that first one was obscuring other faults. Second, this is an opportunity to update my mental model with plenty of work already like writing the list and building any tools that were needed to capture the events. Last, the sort of logging and tools I build for validating my mental model, are often useful in the future when doing more debugging, so completing the path can make me better prepared for next time.
If you found this interesting, give this strategy a whirl. If you are wondering what level of detail I include in my event lists, commonly I’ll fill 1-3 pages with one event per line and some lines scratched out or with arrows drawn in the middle. Usually this documentation gets obsolete very fast. This is because it is nearly as detailed as the code, and only a thin vertical slice for very specific data, not the generalized case. I don’t try to save it or format it for other folks’ consumption. The are just notes for me.
I think this strategy is a step toward fulfilling the statement portion of Aria’s tweet, “Practice this.” One of the people you need to be concerned with the most when trying to describe change in a system, is yourself. Because if you can’t describe it to yourself, how are you ever going to describe it to others?

https://wraithan.net/2016/10/13/describing-and-debugging-change-over-time-in-a-system/
|
|
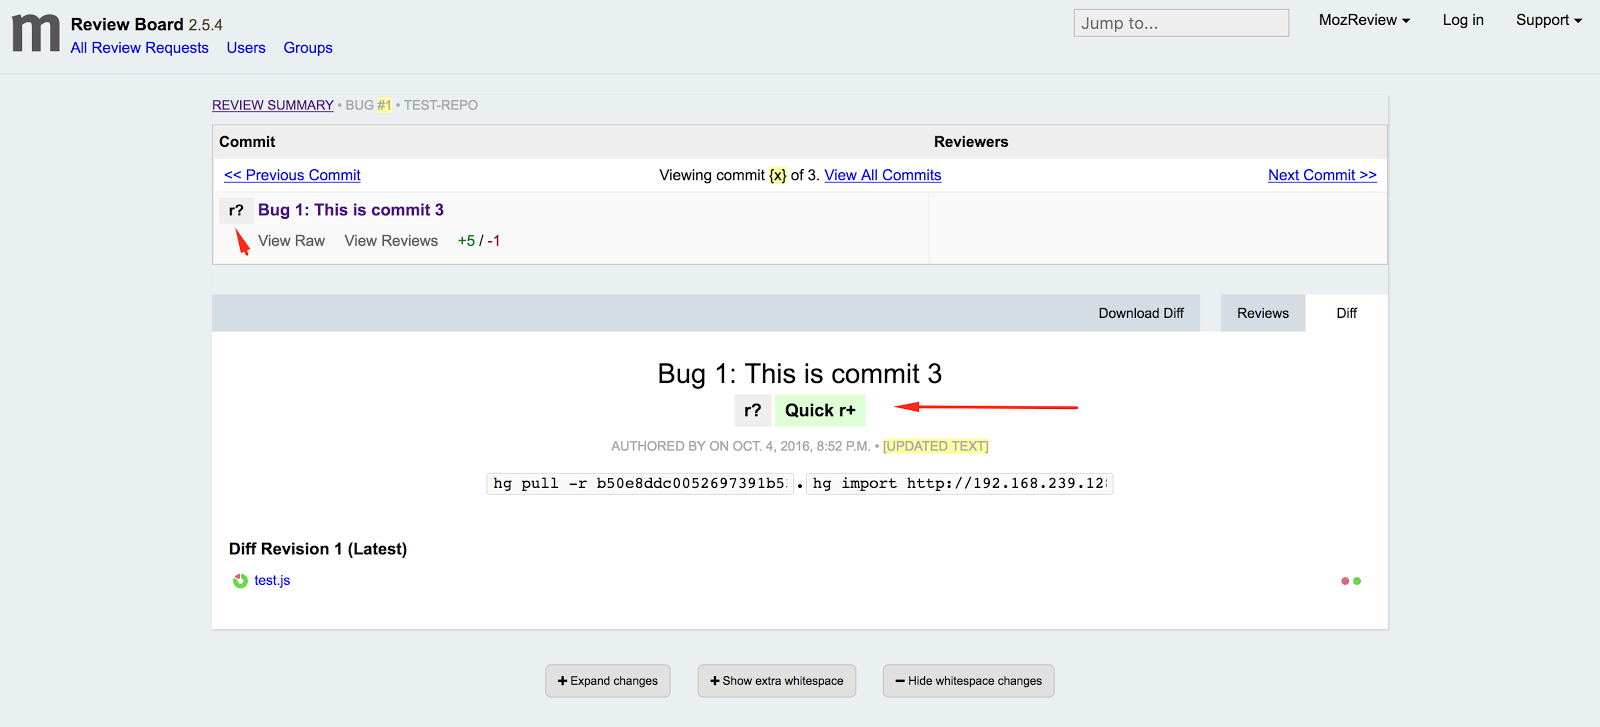
Mark C^ot'e: MozReview UI refactoring |
In Q3 the MozReview team started to focus on tackling various usability issues. We started off with a targetted effort on the “Finish Review” dialog, which was not only visually unappealing but difficult to use. The talented David Walsh compressed the nearly full-screen dialog into a dropdown expanded from the draft banner, and he changed button names to clarify their purpose. We have some ideas for further improvements as well.
David has now embarked on a larger mission: reworking the main review-request UI to improve clarity and discoverability. He came up with some initial designs and discussed them with a few MozReview users, and here’s the result of that conversation:
This design provides some immediate benefits, and it sets us up for some future improvements. Here are the thoughts behind the changes:
The commits table, which was one of the first things we added to stock Review Board, was never in the right place. All the surrounding text and controls reflect just the commit you are looking at right now. Moving the table to a separate panel above the commit metadata is a better, and hopefully more intuitive, representation of the hierarchical relationship between commit series and individual commit.
The second obvious change is that the commit table is now collapsed to show only the commit you are currently looking at, along with its position (e.g. “commit 3 of 5”) and navigation links to previous and next commits. This places the emphasis on the selected commit, while still conveying the fact that it is part of a series of commits. (Even if that series is actually only one commit, it is still important to show that MozReview is designed to operate on series.) To address feedback from people who like always seeing the entire series, it will be possible to expand the table and set that as a preference.
The commit title is still redundant, but removing it from the second panel left the rest of the information there looking rather abandoned and confusing. I’m not sure if there is a good fix for this.
The last functional change is the addition of a “Quick r+” button. This fixes the annoying process of having to select “Finish Review”, set the dropdown to “r+”, and then publish. It also removes the need for the somewhat redundant and confusing “Finish Review” button, since for anything other than an r+ a reviewer will most likely want to leave one or more comments explaining their action. The “Quick r+” button will probably be added after the other changes are deployed, in part because we’re not completely satisfied with its look and position.
The other changes are cosmetic, but they make various data and controls look much slicker while also being more compact.
We are also noodling around with a further enhancement:
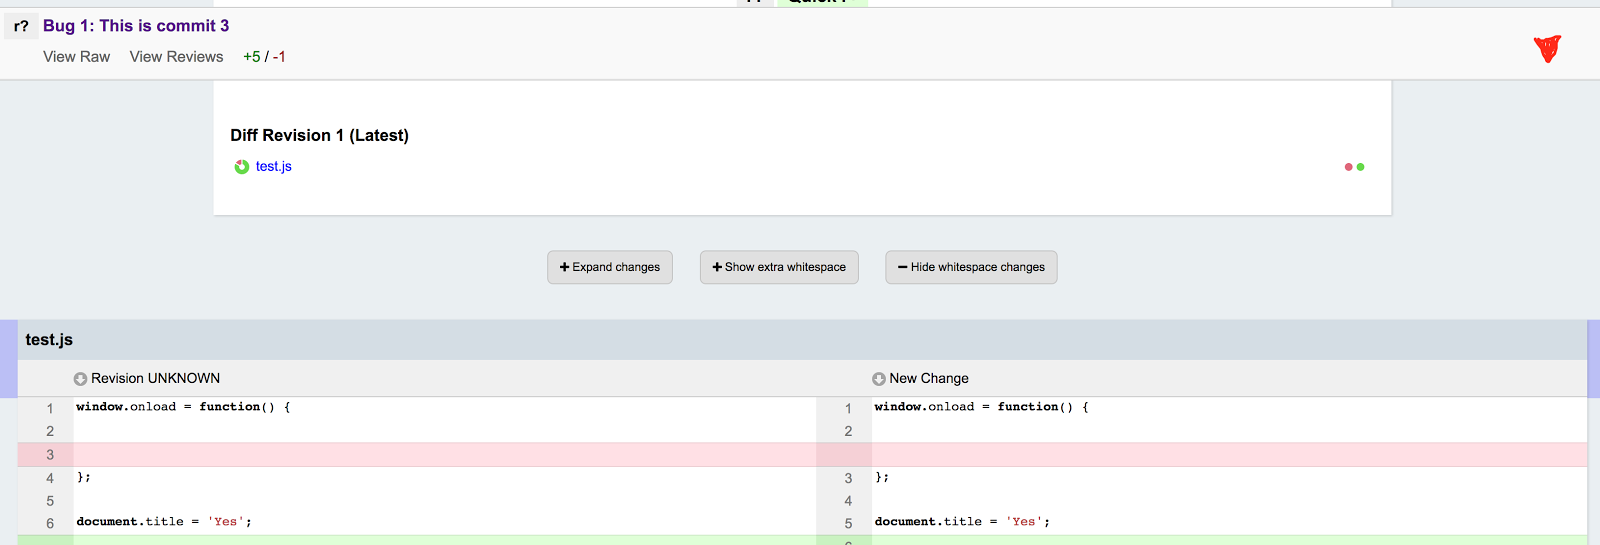
This is a banner containing data about the current commit, which will appear when the user scrolls past the commits table. It provides a constant reminder of the current commit, and we may put in a way to skip up to the commits table and/or navigate between commits. We may also fold the draft/“Finish Review” banner into this as well, although we’re still working out what that would look like. In any case, this should help avoid unnecessary scrolling while also presenting a “you are here” signpost.
As I mentioned, these changes are part of an on-going effort to improve general usability. This refactoring gets us into position to tackle more issues:
Since the commits table will be clearly separated from the commit metadata, we can move the controls that affect the whole series (e.g. autoland) up to the first panel, and leave controls that affect only the current commit (right now, only “Finish Review”/“Quick r+”) with the second panel. Again this should make things more intuitive.
Similarly, this gives us a better mechanism for moving the remaining controls that exist only on the parent review request (“Review Summary”/“Complete Diff”) onto the individual commit review requests, alongside the other series controls. This in turns means that we’ll be able to do away with the parent review request, or at least make some radical changes to it.
MozReview usage is slowly ticking upwards, as more and more Mozillians are seeing the value of splitting their work up into a series of small, atomic commits; appreciating the smooth flow of pushing commits up for review; and especially digging the autoland functionality. We’re now hard at work to make the whole experience delightful.
https://mrcote.info/blog/2016/10/12/mozreview-ui-refactoring/
|
|


