Mozilla Performance Blog: Performance Tools Newsletter (H1 2021) |
As the Perf-Tools team, we are responsible for the Firefox Profiler. This tool is built directly into Firefox to understand the program runtime and analyze it to make it faster. If you are not familiar with it, I would recommend looking at our user documentation.
If you are curious about the profiler but not sure how to get to know it, I’ve also given a FOSDEM talk about using the Firefox Profiler for web performance analysis this year. If you are new to this tool, you can check it out there.
During our talks with the people who use the Firefox Profiler frequently, we realized that new features can be too subtle to notice or easily overlooked. So we’ve decided to prepare this newsletter to let you know about the new features and the improvements that we’ve made in the past 6 months. That way, you can continue to use it to its full potential!
ChromeUtils.addProfilerMarker APISo, let’s get started with the new features.
In the DevTools panel, we still had the old performance tab. That tool was pretty old and not very well maintained for a while. The new Firefox Profiler is a lot more comprehensive compared to the old tool. We aim to make it the new default one. We’ve hit a big milestone and enabled it in the Firefox Dev Edition. We are hoping to get rid of the old panel soon. Thanks to Nicolas Chevobbe and Julian Descottes from the DevTools team for helping out on this!
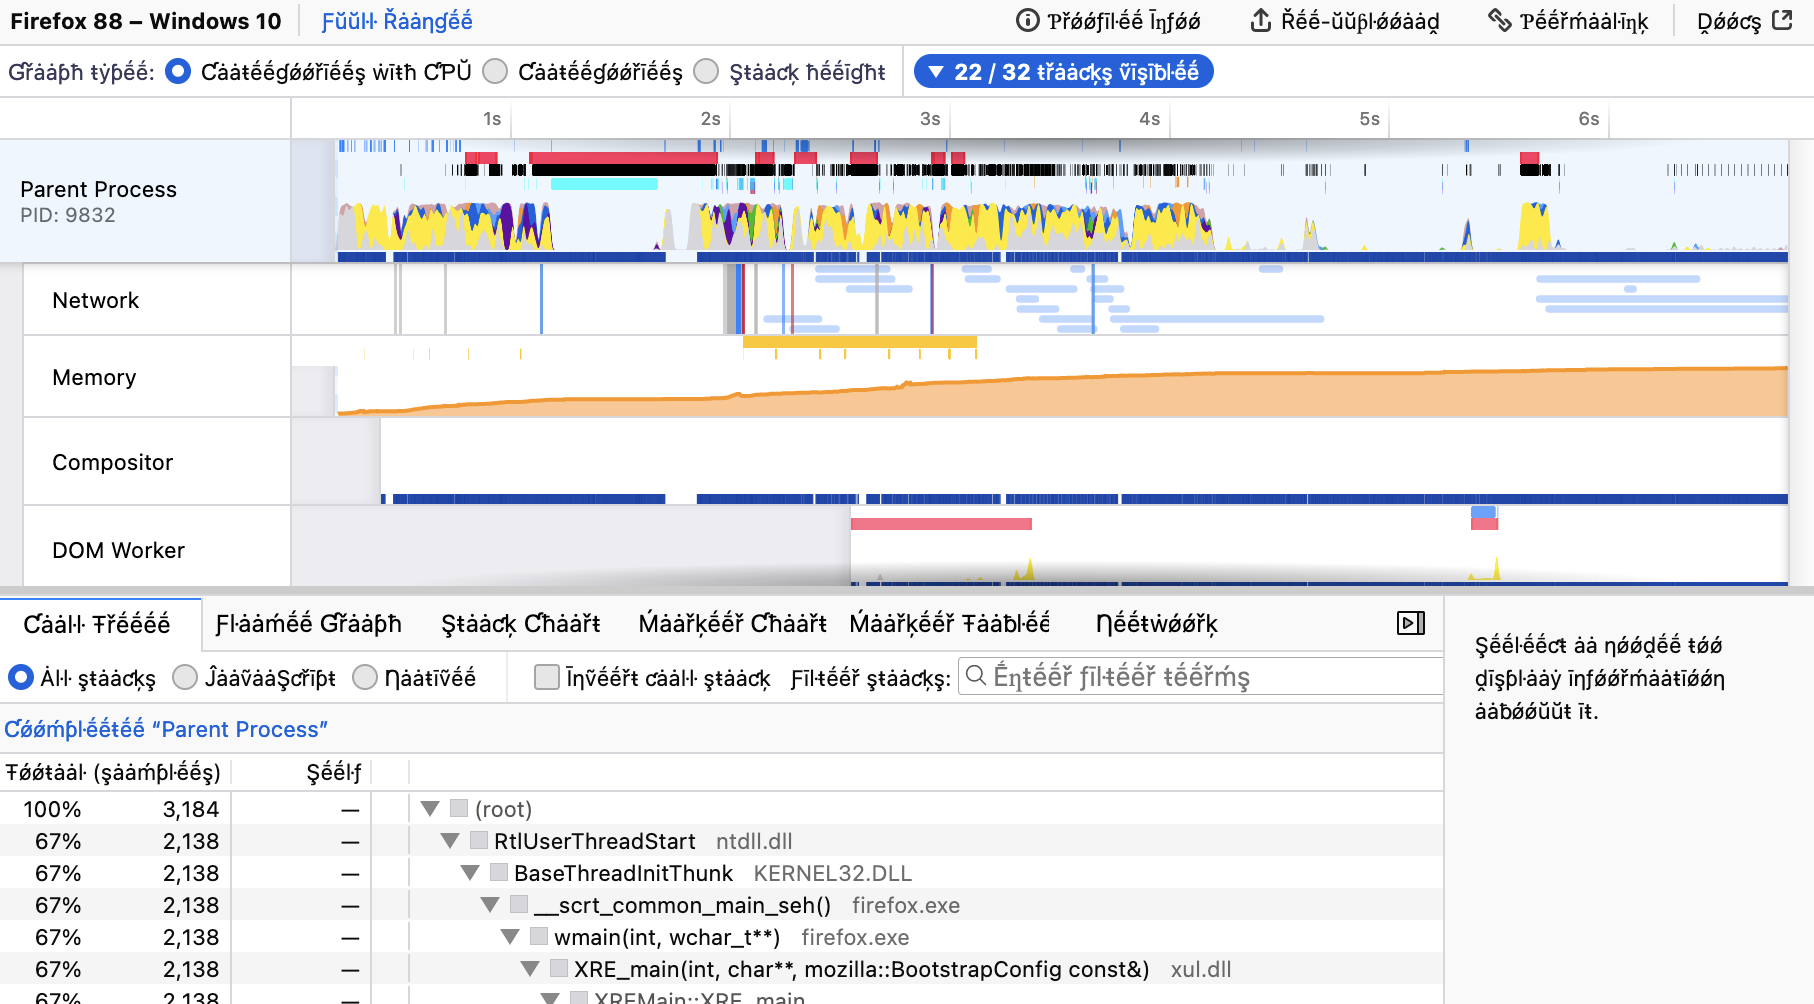
Previously, the height of the activity graph (the graph in the pictures) wasn’t directly tied to the actual amount of work done: We were setting the height to 100% when we saw a non-idle sample there, and then applying some smoothing. But now, we collect the CPU usage information from Firefox and then draw the height of this graph to match the CPU usage of this thread. This allows our users to see which part of the thread is using more CPU and which part of the thread is using less. This is important because our users were thinking that the height actually meant CPU usage already, but it wasn’t the case before. So, it’s good to match our users’ expectations in this case.
This new implementation also gives us information about the places where the Firefox is unresponsive but the thread is not using any CPU. In this case, it can mean that the thread is blocked.
When the graph height is not so high, except waiting for another thread, it can also mean that, either the thread is waiting on disk to write/read a lot, or the whole system is working on a heavy task and not giving Firefox enough CPU time to run.. Previously, it wasn’t possible to figure these cases out, but thanks to the CPU usage information, we can now understand it by looking at a profile.
Here are two example profiles. Both are from a startup of Firefox, but the first one is a warm startup, whereas the second one is a cold startup. You will notice easily that the graph height on the cold startup is a lot lower compared to the warm one. This is because on cold startups, we are reading a lot of data from the disk, and the reference laptop we used to capture these profiles has a slow disk:
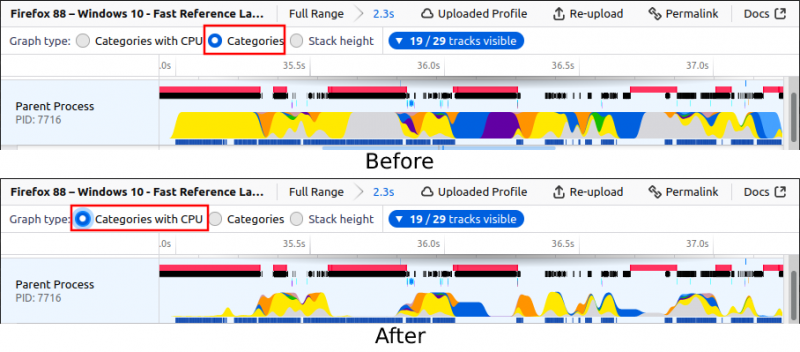
Now we have “Categories with CPU” as a graph type. You can see that the graph is different now when CPU usage numbers differ.
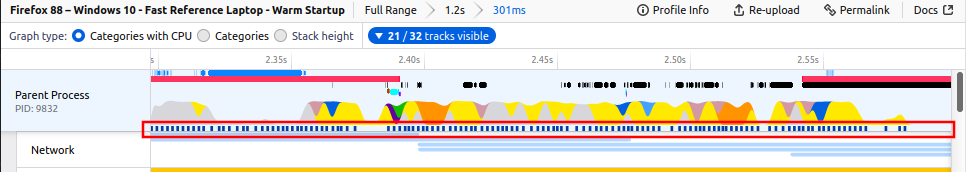
With the previous CPU utilization work, we also added another graph underneath the activity graph. As visible in the image below, you can now see the exact locations of the samples in this graph. You can also click on them to select that sample’s stack. With this graph, it’s also possible to see where we have missing samples. Missing samples usually mean that the profiler can’t keep up with the sampling. It’s good to note that we don’t know exactly what’s happening in these areas of the timeline. You can try to reduce the overhead of the profiler if you have so many missing samples, for example by increasing the sampling interval, because the profile data you captured will not be as reliable when the profiler can’t sample regularly enough.
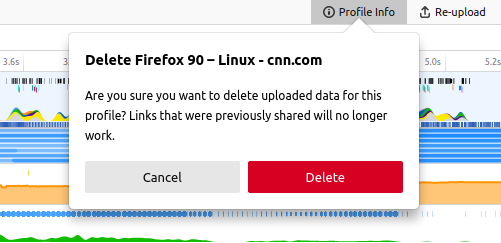
You can find it inside the “Profile Info” popup on the top right corner if you uploaded that profile. Previously we added this page to manage your uploaded profiles. But adding the delete button to the analysis UI was also important, so you can directly delete the profile that you easily uploaded. We keep a key in your browser’s local storage to know that you uploaded that profile data. So, to be able to delete it, you need to use the same browser that you uploaded it from.
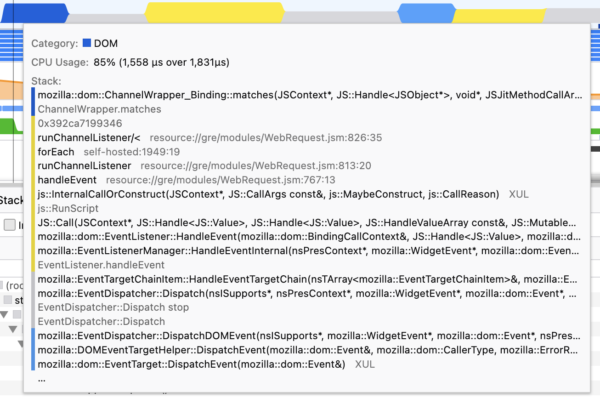
This is a small but a nice addition. We have stacks in tooltips, the marker table and the sidebar. Previously, it wasn’t possible to figure out which function belongs to which category. But with this change, you can now see their category colors on their left side. This gives you a quick overview of what’s happening in this stack.
Gecko Profiler didn’t have a canonical Rust API. We had some hacks for multiple Rust projects, they were all similar but with subtle implementation differences. If you wanted to use profiler API functions in a new Rust project, you had to write everything again and again. We’ve decided to make a canonical Rust crate for the profiler, so people who work on Rust code can easily import and start using it immediately. We’ve landed the first part of this API now, which is about thread registration.
If you are working on a Rust project with multiple threads, don’t forget to register your threads with the Gecko Profiler. After registering them, you will be able to profile them by adding the thread names (or part thereof) to the custom thread names input in about:profiling. It’s pretty straightforward to register them with gecko_profiler::register_thread and gecko_profiler::unregister_thread.
More Rust API functions for the profiler are coming soon!
Our Outreachy intern Hasna Hena Mow (CipherGirl) has worked on the internationalization of the profiler.firefox.com. And thanks to her, this project is complete now! The actual translation process is happening now.
That’s also one of the nice usability improvements. Previously, it wasn’t possible to see the screenshots while selecting a time range. That was a bit annoying, because screenshots are good indicators of what’s happening at that time, and they are usually good indicators when selecting a time range as well. So, now you can see them while selecting a range!
You can now import Android trace format to Firefox Profiler analysis UI easily. Just drag and drop the .trace file into firefox.profiler.com, it will import and open the profile data automatically without any additional steps. You can also open it using the button “Load a profile from file”.
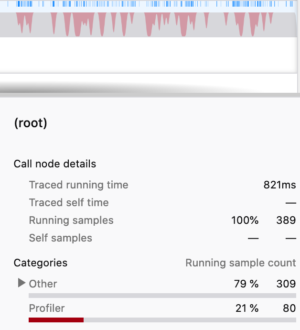
We’ve added a new category to show the profiler overhead. This is a pretty interesting indicator that we didn’t have before, because this is actually showing us how much the profiler itself is affecting the profile that we are capturing. So after capturing a profile, if you see a lot of red categories in the timeline, it usually means that the profiler is working too much and possibly skewing the data you are capturing. In this case, you can try to reduce the overhead of the profiler by going to the about:profiling page and increasing the interval or disabling some of the features.
Another small feature to quickly make all the tracks visible! Quite handy when you have a lot of tracks and don’t know what you are looking for.
Y tracks visible" button." class="aligncenter size-full wp-image-202" height="276" src="http://blog.mozilla.org/performance/files/2021/07/show-all-tracks.png" width="1610" />
Our network markers weren’t always reliable, especially when it comes to service workers. They were mostly marked as “unfinished markers” and not being displayed in the front-end due to lack of correct recording. We’ve made a lot of improvements to make them record properly and in the correct places. Some more fixes are coming in this area.
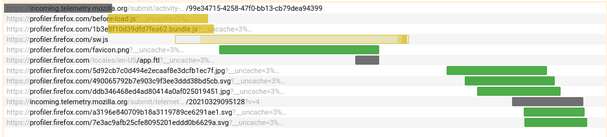
New network markers that belong to a service worker inside the “Network” tab.
This was another big task we wanted to fix for a while. Sometimes, when a stack included JIT (Just In Time-compiled JavaScript) frames, it would fail to find their native calling functions, causing a large number of samples to appear in separate locations from where they should have been. The Profiler can now use JIT information to correctly restart stack walking when needed. It’s a platform-dependent task, and only 64-bit Windows is fixed for now. macOS fixes are in review and will land soon, with other platforms to follow in the coming months.
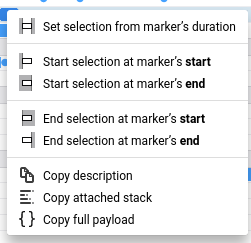
We display context menus in various places. And inside the Marker Chart and Marker Table panels, we are displaying the marker context menu. Previously, it wasn’t really easy to understand and find the item that you want to click, even for people who are used to the profiler. Now, it’s a lot easier to understand and find the item you want to click with better wording, icons, and bold texts where necessary.
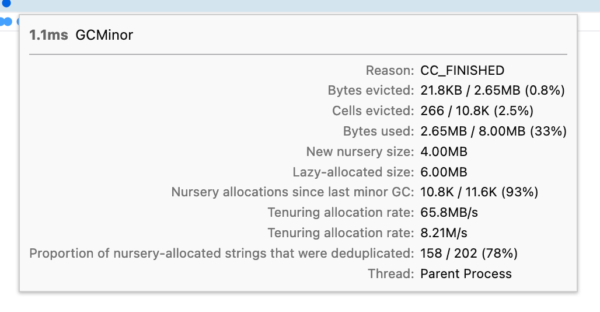
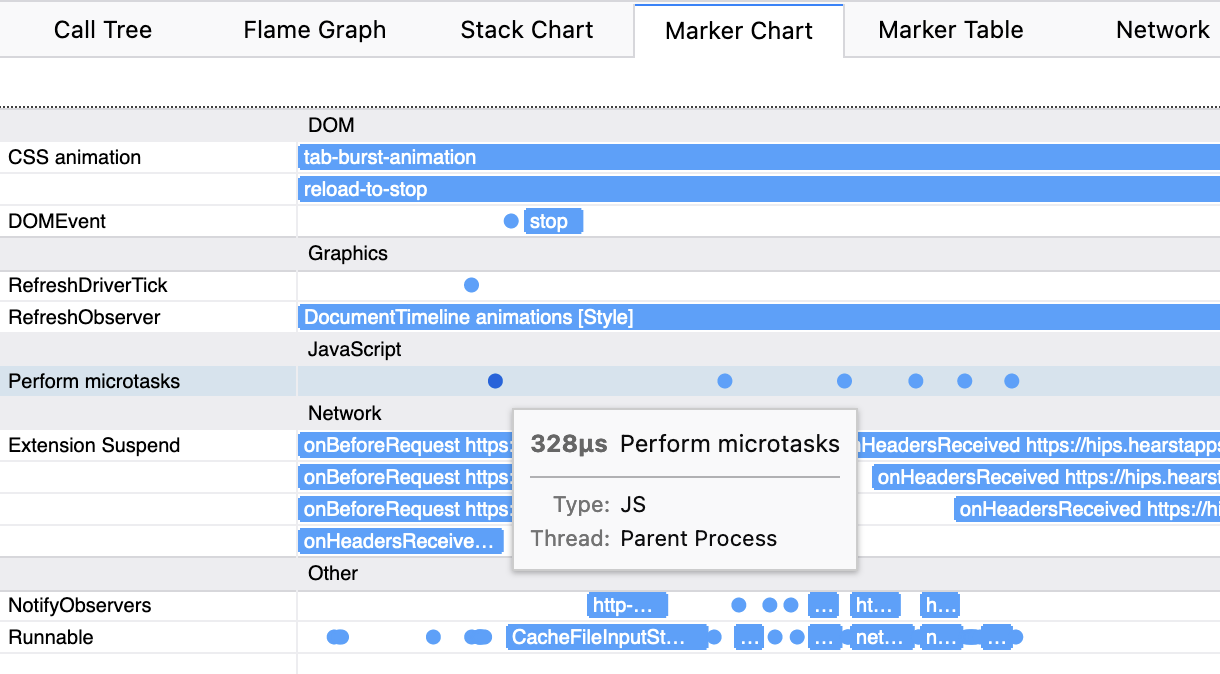
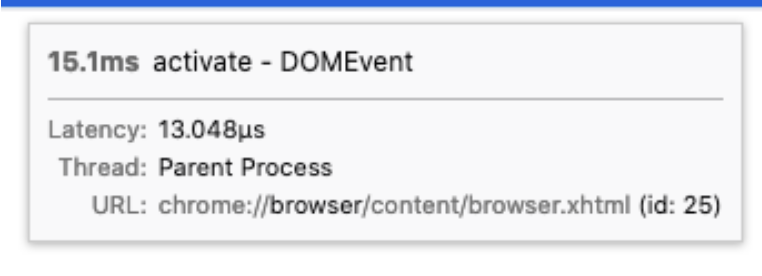
ChromeUtils.addProfilerMarker APIYou may know the ChromeUtils.addProfilerMarker API for capturing a profiler marker from JavaScript. With this change, this API now supports capturing a stack and adding a category to them. Capturing a stack is important when you need to know the cause of an event. This will show up on the marker tooltips in the analysis UI. Similarly, categories will show up on the marker’s tooltip in the Marker Chart, and in the sidebar in the Marker Table.
We had the network track for the visualization of the network markers. Previously it was only showing you where a network request starts and ends, but to be able to see more, you had to switch to the “Network” tab. Now you can directly hover over any network request in this track and it will show you the information about it in a tooltip. More improvements are coming in this area!
We have a profile info button on the top right corner of the analysis page. When you click on this button, we open the Profile Info panel where we display the metadata that were gathered from Firefox. This metadata includes profile related information like recording time and settings, application information like Firefox version and build ID and platform information like OS, ABI and CPU. We got some feedback about this button not being very visible and explicit. Now, it is.
Before:
 After:

This is a small usability improvement for Android folks. It’s in the panel we discussed in the previous improvement. Previously, it was possible to see the Android version, ABI and CPU information in the Platform section. But it wasn’t possible to see the device name which is pretty important most of the time. Now, you can see that in the Profile Info panel on the top right corner.
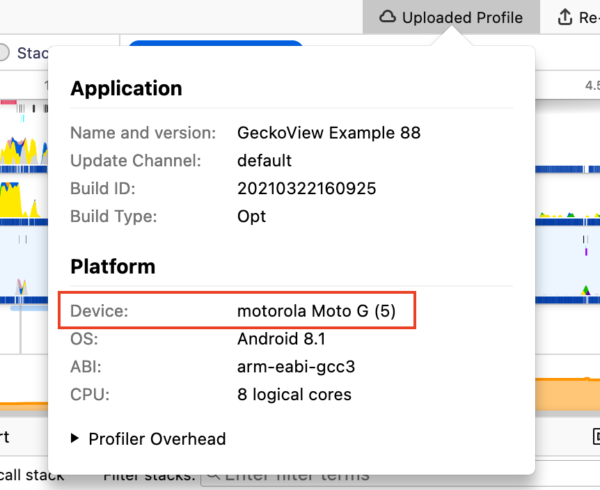
You can see that information under the “platform” section inside Profile Info panel.
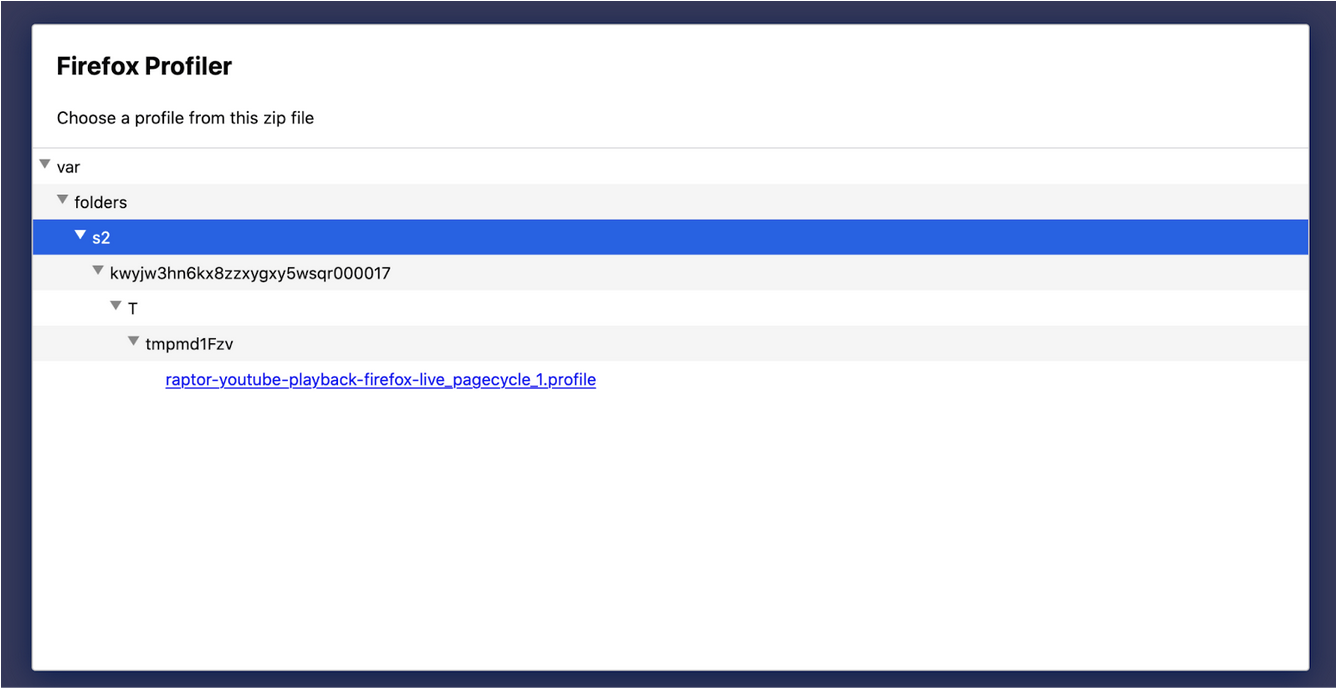
This is another usability improvement. When you open profile data from a zip file (like the ones from treeherder) it’s not always easy to find the profile data you want. Especially because treeherder puts the profile files in a folder that’s buried under some other folders. Now it will be just a click away, because zip file viewer now expands all the children.
When JavaScript code calls an XPIDL method/getter/setter, we weren’t doing a good job showing this. Now, with the new label frames you can see them easily, and with a category change as well. It’s similar to what we already had for WebIDL.
A recent Profiler buffer change was affecting the memory track and was making it hard to see small memory changes unrelated to the Profiler (which typically uses 1MB chunks). With this change, it’s now possible to see these small changes.
The Network Chart panel is more usable with only a keyboard now!
Less places to potentially break on Tier-3 platform builds! We are still incrementally working on reducing the MOZ_GECKO_PROFILER ifdefs to make our and our users’ life easier.
We’ve talked about the things we did so far. There are also so many things we still would like to do. I want to mention some of them here as well, in case you are curious. It’s not going to be a complete list, but at least it can give you some ideas about the direction we are heading as the Performance Tools team.
There is some unfinished work we would like to finish. Like shipping the Firefox Profiler in DevTools panel (also known as the unified profiler project), finishing the JIT stack walking fixes, landing more Rust Profiler APIs. But we also want to work on some new things like: Reducing the overhead of the profiler, making it easier to find unregistered threads and better support for profiling with many threads, making the IPC markers better, collecting CPU usage of all threads and/or processes, making a lot more usability improvements and polishes.
If you also have something on your mind about the things we can improve, please let us know!
Thanks for reading this far! It’s been a busy first half in 2021 and we intend to continue making the Firefox Profiler better with the things I discussed in the previous section. If you have any questions or feedback, please feel free to reach out to me on Matrix (@canova:mozilla.org). You can also reach out to our team on Firefox Profiler channel on Matrix (#profiler:mozilla.org).
If you profiled something and are puzzled with the profile you captured, we also have the Joy of Profiling (#joy-of-profiling:mozilla.org) channel where people share their profiles and get help from the people who are more familiar with the Firefox Profiler. In addition to that, we have the Joy of Profiling Open Sessions where some Firefox Profiler and Performance engineers gather together on Zoom to answer questions or analyze the profiles you captured. It’s usually happening every Monday, and you can follow the “Performance Office Hours” calendar to learn more about it.
https://blog.mozilla.org/performance/2021/07/08/performance-tools-newsletter-h1-2021/
|
|
Mozilla Open Policy & Advocacy Blog: Mozilla publishes policy recommendations for EU Digital Markets Act |
As the Digital Markets Act (DMA) progresses through the legislative mark-up phase, we’re today publishing our policy recommendations on how lawmakers in the European Parliament and EU Council should amend it.
We welcomed the publication of the DMA in December 2020, and we believe that a vibrant and open internet depends on fair conditions, open standards, and opportunities for a diversity of market participants. With targeted improvements and effective enforcement, we believe the DMA could help restore the internet to be the universal platform where any company can advertise itself and offer its services, any developer can write code and collaborate with others to create new technologies on a fair playing field, and any consumer can navigate information, use critical online services, connect with others, find entertainment, and improve their livelihood
Our key recommendations can be summarised as follows:
We spell out these recommendations in detail in our position paper, and provide practical guidance for lawmakers on how to amend the DMA draft law to incorporate them. As the DMA discussions continue in earnest, we look forward to working with EU lawmakers and the broader community of policy stakeholders to help ensure a final legislative text that promotes a healthy internet that puts competition and consumer choice first.
The post Mozilla publishes policy recommendations for EU Digital Markets Act appeared first on Open Policy & Advocacy.
|
|
The Mozilla Blog: Firefox extends privacy and security of Canadian internet users with by-default DNS-over-HTTPS rollout in Canada |
In a few weeks, Firefox will start the by-default rollout of DNS over HTTPS (or DoH for short) to its Canadian users in partnership with local DoH provider CIRA, the Canadian Internet Registration Authority. DoH will first become a default for 1% of Canadian Firefox users on July 20 and will gradually reach 100% of Canadian Firefox users in late September 2021 – thereby further increasing their security and privacy online. This follows the by-default rollout of DoH to US users in February 2020.
As part of the rollout, CIRA joins Mozilla’s Trusted Recursive Resolver (TRR) Program and becomes the first internet registration authority and the first Canadian organization to provide Canadian Firefox users with private and secure encrypted Domain Name System (DNS) services.
“Unencrypted DNS is a major privacy issue and part of the legacy of the old, insecure, Internet. We’re very excited to be able to partner with CIRA to help fix that for our Canadian users and protect more of their browsing history by default.”
Eric Rescorla, Firefox CTO.
“Protecting the privacy of Canadians is a key element of restoring trust on the internet. Our goal is to cover as many Canadians as possible with Canadian Shield, and that means finding like-minded partners who share our values. We are proud to be the first Canadian participant in the Trusted Recursive Resolver (TRR) Program and are always seeking out new ways to extend the reach of Canadian Shield to enhance the privacy of Canadians.”
Byron Holland, president and CEO, CIRA.
Once enrolled, Firefox users located in Canada will see a terminology panel pop up (see screenshot below) that will ask them to approve or opt out of DoH protection. When going to Settings in the settings menu in Firefox, then scrolling down to the Network Settings section and clicking on the Network Settings button, a dialogue box will open. Canadian Firefox users will be able to confirm that “CIRA Canadian Shield” is enabled by looking at the bottom of the dialogue box. They will also have the option to choose Cloudflare or NextDNS as an alternative Trusted Recursive Resolver.

For more than 35 years, DNS has served as a key mechanism for accessing sites and services on the internet. Functioning as the internet’s address book, DNS translates website names, like Firefox.com and cira.ca, into the internet addresses that a computer understands so that the browser can load the correct website.
Since 2018, Mozilla, CIRA, and other industry stakeholders have been working to develop, standardize, and deploy a technology called DNS over HTTPS (or DoH). DoH helps to protect browsing activity from interception, manipulation, and collection in the middle of the network by encrypting the DNS data.
Encrypting DNS data with DoH is the first step. A necessary second step is to require that the companies handling this data have appropriate rules in place – like the ones outlined in Mozilla’s TRR Program. This program aims to standardize requirements in three areas: limiting data collection and retention from the resolver, ensuring transparency for any data retention that does occur, and limiting any potential use of the resolver to block access or modify content. By combining the technology, DoH, with strict operational requirements for those implementing it, participants take an important step toward improving user privacy.
CIRA is the latest resolver, and the first internet registration authority, to join Firefox’s TRR Program, joining Cloudflare, NextDNS and Comcast. Mozilla began the rollout of encrypted DNS over HTTPS (DoH) by default for US-based Firefox users in February 2020, but began testing the protocol in 2018 and DoH has been available worldwide for Firefox users who choose to turn it on.
DoH is just one of the many privacy protections we provide to our users, like Enhanced Tracking Protection by default in Firefox and the Mozilla VPN.
The post Firefox extends privacy and security of Canadian internet users with by-default DNS-over-HTTPS rollout in Canada appeared first on The Mozilla Blog.
https://blog.mozilla.org/en/mozilla/news/firefox-by-default-dns-over-https-rollout-in-canada/
|
|
This Week In Rust: This Week in Rust 398 |
Hello and welcome to another issue of This Week in Rust! Rust is a systems language pursuing the trifecta: safety, concurrency, and speed. This is a weekly summary of its progress and community. Want something mentioned? Tweet us at @ThisWeekInRust or send us a pull request. Want to get involved? We love contributions.
This Week in Rust is openly developed on GitHub. If you find any errors in this week's issue, please submit a PR.
fcp 0.2.0 released - A significantly faster alternative to cpThis week's crate is css-inline, a crate to inline CSS into style tags.
Thanks to Dmitry Dygalo for the suggestion.
Submit your suggestions and votes for next week!
Always wanted to contribute to open-source projects but didn't know where to start? Every week we highlight some tasks from the Rust community for you to pick and get started!
Some of these tasks may also have mentors available, visit the task page for more information.
Synth
Sycamore
If you are a Rust project owner and are looking for contributors, please submit tasks here.
297 pull requests were merged in the last week
ForceWarn a lint leveltcx allocated allocationsis_multilineloopcheck_expr_return()no_global_oom_handling: disable new()s, pin()s, etc.str::from_utf8_unchecked as conststring_drain_as_strBound::cloned()Seek::rewind()process::Command on Windows, environment variable names must be case-preserving but case-insensitivetrack_path::path fn for usage in proc_macrosround and roundfoffline and frozencargo clippy --fixnonstandard_macro_braces to nurserydoc(hidden) or unstable variants in wildcard lintproc_)macros for nonstandard_macro_braces lintdoc_markdown false positiverc_mutexstrlen_on_c_stringsdisallowed_script_identsA fairly mixed week with improvements and regressions mostly balancing themselves out. The highlight of this week is we have now started to adopt a new performance triage process which will label PRs that introduce performance regressions with the perf-regression label. Authors and/or reviewers are expected to justify their performance regression either by a short summary of why the change is worth it despite the regression or by creating an issue to follow-up on the regression.
We hope this process will lead to better compiler performance in the long term.
Triage done by @rylev. Revision range: 5a78340..9a27044
2 Regressions, 3 Improvements, 2 Mixed 1 of them in rollups
Changes to Rust follow the Rust RFC (request for comments) process. These are the RFCs that were approved for implementation this week:
No RFCs were approved this week.
Every week the team announces the 'final comment period' for RFCs and key PRs which are reaching a decision. Express your opinions now.
#[derive(Default)] on enums with a #[default] attributeimpl From<[(K, V); N]> for HashMap (and friends)No new RFCs were proposed this week.
.*-?(lang|script)\If you are running a Rust event please add it to the calendar to get it mentioned here. Please remember to add a link to the event too. Email the Rust Community Team for access.
StructionSite
ChainSafe Systems
InfinyOn
Merantix
NORICS GmbH
NZXT
Parity Technologies
Esturary
Kraken
Subspace Network
Tweet us at @ThisWeekInRust to get your job offers listed here!
One thing I like about Rust is that it filters out lazy/sloppy thinkers. Even when I disagree with another Rust programmer, there is a certain level of respect that comes from knowing that they thought about the problem deeply enough to pass the borrow checker.
Thanks to Jonah for the self-suggestion!
Please submit quotes and vote for next week!
This Week in Rust is edited by: nellshamrell, llogiq, and cdmistman.
https://this-week-in-rust.org/blog/2021/07/07/this-week-in-rust-398/
|
|
Chris H-C: Responsible Data Collection is Good, Actually (Ubisoft Data Summit 2021) |
In June I was invited to talk at Ubisoft’s Data Summit about how Mozilla does data. I’ve given a short talk on this subject before, but this was an opportunity to update the material, cover more ground, and include more stories. The talk, including questions, comes in at just under an hour and is probably best summarized by the synopsis:
Learn how responsible data collection as practiced at Mozilla makes cataloguing easy, stops instrumentation mistakes before they ship, and allows you to build self-serve analysis tooling that gets everyone invested in data quality. Oh, and it’s cheaper, too.
If you want to skip to the best bits, I included shameless advertising for Mozilla VPN at 3:20 and becoming a Mozilla contributor at 14:04, and I lose my place in my notes at about 29:30.
Many thanks to Mathieu Nayrolles, Sebastien Hinse and the Data Summit committee at Ubisoft for guiding me through the process and organizing a wonderful event.
:chutten
|
|
Data@Mozilla: Responsible Data Collection is Good, Actually (Ubisoft Data Summit 2021) |
In June I was invited to talk at Ubisoft’s Data Summit about how Mozilla does data. I’ve given a short talk on this subject before, but this was an opportunity to update the material, cover more ground, and include more stories. The talk, including questions, comes in at just under an hour and is probably best summarized by the synopsis:
Learn how responsible data collection as practiced at Mozilla makes cataloguing easy, stops instrumentation mistakes before they ship, and allows you to build self-serve analysis tooling that gets everyone invested in data quality. Oh, and it’s cheaper, too.
If you want to skip to the best bits, I included shameless advertising for Mozilla VPN at 3:20 and becoming a Mozilla contributor at 14:04, and I lose my place in my notes at about 29:30.
Many thanks to Mathieu Nayrolles, Sebastien Hinse and the Data Summit committee at Ubisoft for guiding me through the process and organizing a wonderful event.
:chutten
|
|
Mozilla Localization (L10N): Better Understanding Pontoon Notifications to Improve Them |
As l10n-drivers, we strongly believe that notifications are an important tool to help localizers organize, improve, and prioritize their work in Pontoon. In order to make them more effective, and focus our development work, we first needed to better understand how localizers use them (or don’t).
In the second quarter of 2021, we ran a couple of experiments and a survey to get a clearer picture of the current status, and this blog post describes in detail the results of this work.
First of all, we needed a baseline to understand if the experiments were making significant changes. Unfortunately, this data is quite hard to measure, since there are a lot of factors at play:
With that in mind, we decided to repeat the same process every month:
| BASELINE | EXPERIMENT 1 | EXPERIMENT 2 | |
| Observation period | April 5-19 | May 3-17 | May 31 – June 14 |
| Data collected on | May 3 | May 31 | June 28 |
| Sent | 27043 | 12593 | 15383 |
| Read | 3172 | 1571 | 2198 |
| Recipients | 3072 | 2858 | 3370 |
| Read 1+ | 140 (4.56%) | 125 (4.37%) | 202 (5.99%) |
| Users logged in | 517 | 459 | 446 |
For the 1st experiment, we decided to promote the Pontoon Add-on. This add-on, among other things, allows users to read Pontoon notifications directly in the browser (even if Pontoon is not currently open), and receive a system notification when there are new messages to read.
 Pontoon would detect if the add-on is already installed. If not, it would display an infobar suggesting to install the add-on. Users could also choose to dismiss the notification: while we didn’t track how many saw the banner, we know that 393 dismissed it over the entire quarter.
Unfortunately, this experiment didn’t seem to have an immediate positive impact on the number of users reading notifications (it actually decreased slightly). On the other hand, the number of active users of the add-on has been slowly but steadily increasing, so we hope that will have an impact in the long term.
 Thanks to Michal Stanke for creating the add-on in the first place, and helping us implement the necessary changes to make the infobar work in Pontoon. In the process, we also made this an “official” add-on on AMO, undergoing a review for each release.
For the 2nd experiment, we made a slight change to the notifications icon within Pontoon, given that we always suspected that the existing one was not very intuitive. The original bell icon would change color from gray to red when new notifications are available, the new one would display the number of unread notifications as a badge over the icon — a popular UX pattern.
 This seemed to have a positive impact on the number of users reading notifications, as the ratio of recipients reading notifications has increased by over 30%. Note that it’s hard to isolate the results of this experiment from the other work raising awareness around notifications (first experiment, blog posts, outreach, or even the survey).
Between May 26 and June 20, we ran a survey targeting users who were active in Pontoon within the last 2 years. In this context, “active” means that they submitted at least one translation over that period.
We received 169 complete responses, and these are the most significant points (you can find the complete results here).
On a positive note, the spread of the participants’ experience was surprisingly even: 34.3% have been on Pontoon for less than a year, 33.1% between 1 and 4 years, 32.5% for more than 4 years.
7% of participants claim that they don’t know what their role is in Pontoon. That’s significant, even more so if we account for participants who might have picked “translator” while they’re actually contributors (I translate, therefore I’m a translator). Clearly, we need to do some work to onboard new users and help them understand how roles work in Pontoon, or what’s the lifecycle of a suggestion.
53% of people don’t check Pontoon notifications. More importantly, almost 63% of these users — about 33% of all participants — didn’t know Pontoon had them in the first place! 19% feel like they don’t need notifications, which is not totally surprising: volunteers contribute when they can, not necessarily when there’s work to do. Here lies a significant problem though: notifications are used for more than just telling localizers “this project has new content to localize”. For example, we use notifications for commenting on specific errors in translations, to provide more background on a specific string or a project.
As for areas where to focus development, while most features were considered between 3 and 5 on a 1-5 importance scale, the highest rated items were:
First of all, thanks to all the localizers who took the time to answer the survey, as this data really helps us. We’ll need to run it again in the future, after we do more changes, in particular to understand how the data evolves around notifications discoverability and awareness.
As an immediate change, given the results of experiment 2, we plan to keep the updated notification icon as the new default.
https://blog.mozilla.org/l10n/2021/07/06/better-understanding-pontoon-notifications-to-improve-them/
|
|
Daniel Stenberg: curl reaches 100K raised |
I’m proud and happy to mention that curl just passed the magic limit of 100,000 USD in raised sponsorship money. Or call it donations if you want. Since April 2018. That’s about 40 months.


A grand total of 440 awesome organizations and individuals have donated money to the curl project since we started our Open Collective fund, at almost 1300 separate occasions. It makes the averages to be about 77 USD per donation and 230 USD per sponsor. As usual, there’s a very long tail of single sponsors that donated a small amount and there’s a small set of sponsors who have donated lots of money many times.

We use donated money primarily for the bug-bounty, but recently we also spread sticker love across the world with the help of donated funds. The fund will also be used to pay for our annual developer meetups (that have been paused during covid) and potentially for some hardware and other infrastructure to aid the project and it’s core contributors.
Note: that we also have a set of sponsors who fund services and infrastructure directly for us without funneling the money through us. The shear value of those services are in several instances even greater in total than what the largest monetary contributors have given us.
This counts the 100K USD net amount that ended up in our fund. That is with the fees involved already deducted. Gross, that means we were given more than 100K already.
We never saw any serious donations to speak of before we started this collective. Before then we received the occasional donations to my PayPal account but they were very spurious and very far apart and never amounted to any “real money”.
I want to take this opportunity and remind readers that curl is a totally independent and stand-alone project. We’re not part of any larger/umbrella organization and we’re not run or owned by any company. It gives us total freedom to do whatever we want but it also means we need to fund things ourselves and find our own benefactors. Fortunately, we have many friends!
https://daniel.haxx.se/blog/2021/07/06/curl-reaches-100k-raised/
|
|
Daniel Stenberg: curl user survey 2021 |
It is time to once again tell you that people responded very similarly to how they did last year…
curl user survey 2021 analysys
Not a lot changed this year compared to last year. Perhaps the biggest three changes this year were that
1. HTTP/3, Unix domain sockets and DNS-over-HTTPS increased significantly among “used features”
2. NSS and GnuTLS both had their usage shares among used TLS libraries fall significantly.
3. My twitter account and this blog are now top-voted as the two channels people follow mostly for participation in curl related topics.
The most used protocols are of course still HTTPS and HTTP, and the newest supported protocol (GOPHERS) checks in as the least used protocol this time around.
Much more details can be found in the linked PDF. Enjoy.
https://daniel.haxx.se/blog/2021/07/05/curl-user-survey-2021/
|
|
Francois Marier: Zoom WebRTC links |
Most people connect to Zoom via a proprietary client which has been on the receiving end of a number of security and privacy issues over the past year, with some experts even describing it as malware.
It's not widely known however that Zoom offers a half-decent WebRTC client which means cross-platform one-click access to a Zoom room or webinar without needing to install any software.
Given a Zoom link such as
https://companyname.zoom.us/j/123456789?pwd=letmein, you can use
https://zoom.us/wc/join/123456789?pwd=letmein to connect in your browser.
Notice that the pool of Zoom room IDs is global and you can just drop the
companyname from the URL.
In my experience however, Jitsi has much better performance than Zoom's WebRTC client. For instance, I've never been able to use Zoom successfully on a Raspberry Pi 4 (8GB), but Jitsi works quite well. If you have a say in the choice of conference platform, go with Jitsi instead.
|
|
This Week In Rust: This Week in Rust 397 |
Hello and welcome to another issue of This Week in Rust! Rust is a systems language pursuing the trifecta: safety, concurrency, and speed. This is a weekly summary of its progress and community. Want something mentioned? Tweet us at @ThisWeekInRust or send us a pull request. Want to get involved? We love contributions.
This Week in Rust is openly developed on GitHub. If you find any errors in this week's issue, please submit a PR.
This week's crate is hypergraph, graph data structure implementation where edges can join arbitrary numbers of vertices.
Thanks to Davy Duperron for the suggestion.
Submit your suggestions and votes for next week!
Always wanted to contribute to open-source projects but didn't know where to start? Every week we highlight some tasks from the Rust community for you to pick and get started!
Some of these tasks may also have mentors available, visit the task page for more information.
If you are a Rust project owner and are looking for contributors, please submit tasks here.
284 pull requests were merged in the last week
future_prelude_collision lintZip::next_backio::Cursor::{remaining, remaining_slice, is_empty}fmt::Arguments::as_str unstably const::Y We only have partial results this week (more details in full report). From the results we have collected, we have one small regression and several improvements. Also, there was a broad max-rss regression from 11 days ago. and narrower max-rss regression from 9 days ago.
Triage done by @pnkfelix. Revision range: 406d4a9..5a78340 Revision range: 7c3872e..7ede6e2
1 Regressions, 5 Improvements, 0 Mixed; 1 of them in rollups
Changes to Rust follow the Rust RFC (request for comments) process. These are the RFCs that were approved for implementation this week:
No RFCs were approved this week.
Every week the team announces the 'final comment period' for RFCs and key PRs which are reaching a decision. Express your opinions now.
#[derive(Default)] on enums with a #[default] attributeimpl From<[(K, V); N]> for HashMap (and friends).*-?(lang|script)\If you are running a Rust event please add it to the calendar to get it mentioned here. Please remember to add a link to the event too. Email the Rust Community Team for access.
Field 33
Georg Fischer
Rhebo
ChainSafe Systems
Mimo
Anixe
NZXT
Kollider
Ockam
Tweet us at @ThisWeekInRust to get your job offers listed here!
When a panic has a payload that's an object which needs Drops,
And the panic hits a catch_unwind for unexpected stops
Before if its Drop panicked we'd just crash to your desktops,
Now the payload gets forgotten, and you'd better grab some mops!
Thanks to Josh Triplett for the self-suggestion!
Please submit quotes and vote for next week!
This Week in Rust is edited by: nellshamrell, llogiq, and cdmistman.
https://this-week-in-rust.org/blog/2021/06/30/this-week-in-rust-397/
|
|
Wladimir Palant: Having fun with CSS injection in a browser extension |
|
|
Mozilla Performance Blog: Performance Sheriff Newsletter (May 2021) |
|
|
The Mozilla Blog: Take control over your data with Rally, a novel privacy-first data sharing platform |
Mozilla teams up with Princeton University researchers to enable crowdsourced science for public good; collaborates with research groups at Princeton, Stanford on upcoming studies.
Your data is valuable. But for too long, online services have pilfered, swapped, and exploited your data without your awareness. Privacy violations and filter bubbles are all consequences of a surveillance data economy. But what if, instead of companies taking your data without giving you a say, you could select who gets access to your data and put it to work for public good?
Today, we’re announcing the Mozilla Rally platform. Built for the browser with privacy and transparency at its core, Rally puts users in control of their data and empowers them to contribute their browsing data to crowdfund projects for a better Internet and a better society. At Mozilla, we’re working on building a better internet, one that puts people first, respects their privacy and gives them power over their online experience. We’ve been a leader in privacy features that help you control your data by blocking trackers. But, being “data-empowered” also requires the ability to choose who you want to access your data.
“Cutting people out of decisions about their data is an inequity that harms individuals, society and the internet. We believe that you should determine who benefits from your data. We are data optimists and want to change the way the data economy works for both people and day-to-day business. We are excited to see how Rally can help understand some of the biggest problems of the internet and make it better.”
Rebecca Weiss, Rally Project Lead
As a first step on this journey, we’re launching the new Rally research initiative, a crowdsourced scientific effort we developed in collaboration with professor Jonathan Mayer’s research group at Princeton University. Computer scientists, social scientists and other researchers will be able to launch groundbreaking studies about the web and invite you to participate. A core focus of the initiative is enabling unprecedented studies that hold major online services accountable.
“Online services constantly experiment on users, to maximize engagement and profit. But for too long, academic researchers have been stymied when trying to experiment on online services. Rally flips the script and enables a new ecosystem of technology policy research.”
Jonathan Mayer, Princeton’s Center for Information Technology Policy
We’re kickstarting the Mozilla Rally research initiative with our first two research collaborator studies. Our first study is “Political and COVID-19 News” and comes from the Princeton team that helped us develop the Rally research initiative. This study examines how people engage with news and misinformation about politics and COVID-19 across online services.
Soon, we’ll also be launching our second academic study, “Beyond the Paywall”, a study, in partnership with Shoshana Vasserman and Greg Martin of the Stanford University Graduate School of Business. It aims to better understand news consumption, what people value in news and the economics that could build a more sustainable ecosystem for newspapers in the online marketplace.
“We need research to get answers to the hard questions that we face as a society in the information age. But for that research to be credible and reliable, it needs to be transparent, considered and treat every participant with respect. It sounds simple but this takes a lot of work. It needs a standard bearer to make it the expectation in social science. In working with Rally, we hope to be part of that transformation.”
Shoshana Vasserman, Assistant Professor of Economics at the Stanford Graduate School of Business
We are also launching a new toolkit today, WebScience, that enables researchers to build standardized browser-based studies on Rally. WebScience also encourages data minimization, which is central to how Rally will respect people who choose to participate in studies. WebScience was developed and open sourced by Jonathan Mayer’s team at Princeton and is now co-maintained with Mozilla.
With Rally, we’ve built an innovative, consent-driven data sharing platform that puts power back into the hands of people. By leveraging the scale of web browsers – a piece of software used by billions of people around the world – Rally has the potential to help address societal problems we could not solve before. Our goal is to demonstrate that there is a case for an equitable market for data, one where every party is treated fairly, and we welcome mission-aligned organizations that want to join us on this journey.
Rally is currently available for Firefox desktop users over age 19 in the United States. We plan to launch Rally for other web browsers and in other countries in the future.
To participate in Rally, join us at rally.mozilla.org.
————————————————————————————
Interested in joining Rally and want to know how it works?
When you join Rally, you have the opportunity to participate in data crowdsourcing projects — we call them “studies” — focused on understanding and finding solutions for social problems caused by the data economy. You will always see a simple explanation of a study’s purpose, the data it collects, how the data will be used, and who will have access to your data. All your data is stored in Mozilla’s restricted servers, and access to the analysis environment is tightly controlled. For those who really want to dig deep, you can read our detailed disclosures and even inspect our code.
The post Take control over your data with Rally, a novel privacy-first data sharing platform appeared first on The Mozilla Blog.
|
|
Daniel Stenberg: On the GitHub ReadMe podcast |
On May 17, I joined the Kathy and Brian, the hosts of the GitHub ReadMe podcast on a video meeting from my home and we had a chat. Mostly about my work on curl. Today the episode “aired”.
You find it here. Also: Spotify. Apple podcasts. RSS feed.
curl is one of the most widely used software component in the world. It is over twenty years old and I am the founder and I still work as lead developer and head honcho. It works!
We talked about how I got into computers and open source in general. How curl started and about how it works to drive such a project, do releases and how to work on it as a full-time job. I am far from alone in this project – I’m just the captain of this ship with a large about of contributors onboard!
As a part of the promotion for this episode, I was photographed by a professional outside of my house and nearby on a very lovely summer’s evening. In a southern suburb of Stockholm, Sweden. So, not only does the GitHub material feature not previously seen images of me, since I’ve been given the photos I can now use them for various things going forward. Like for when I do presentations and organizers ask for photos etc.
The photos I’ve used most commonly up until this point are the ones a professional photographer took of me when I spoke at the Velocity conference in New York in 2015. Of course I’m eternally young, but for some reason those past six years are visible on me…
I’ve participated in some podcasts before. If my count is correct, this is the 19th time. See the whole list.
The new set of photos of me were shot by Evia Photos. One of them is used on the top of this page.
https://daniel.haxx.se/blog/2021/06/22/on-the-github-readme-podcast/
|
|


