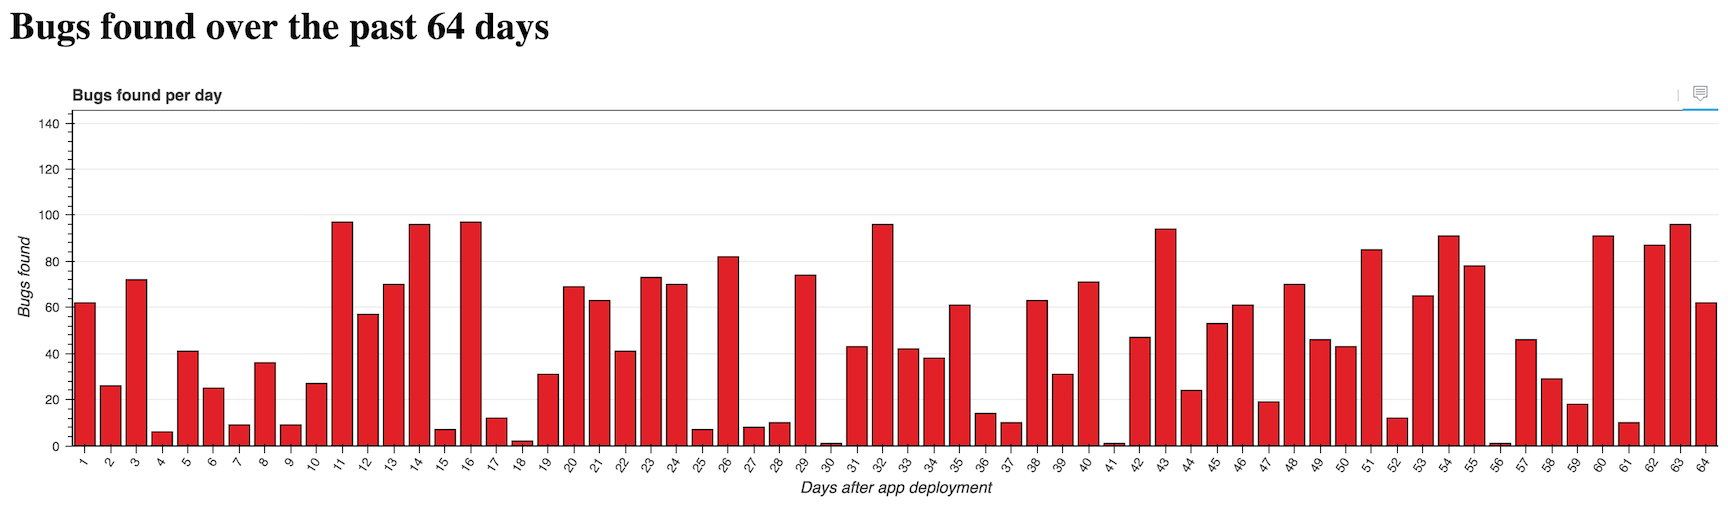
[�������] ���������� ���������� ��������� � Bokeh, Flask � Python 3 |
������� ��������� � python digest �� �������� �� Flask+Bokeh. �������� ������������ �� ��������, �� ��������� ���� ����� ��������� Python � HTML. ������� �������� ��� Ubuntu 16.04, �� Windows ������� ���������� ������ � ������������ �����������.
Bokeh � ��� ������ ���������� � �������� �������� �����, ������� ��������� ��������������� ������ ��� ���-����������, �� ������� �� ������� �� javascript. �������� ��������� ��� ������������ ����� d3.js ����� ��������� ��������, �� ������� ����� �������� ��������� ����� ���� �� Python, ����� ������ ������.
� Bokeh �� ����� ��������� ������������ ��������� ������������� ������������ ��� �� ����� ������� ����, ����� ���������� ��������.
������� ���������, ��� ����� ������������ Flask � Bokeh ��� ������������ ������ � ���-����������.
��, ��� ������� �����, �������� ��� �� Python 2, ��� � �� Python 3, ������, ������������� ������������ Python 3 ��� ����� ����������. � ����������� Python 3.6.1 �� ������ ��������� ���� ������. ������ ������ Python, ��� ����������� ��������� �����������:
���� ��� ����� �������������� �������� �� ��������� ��������� ����������, ������ ���������� � �����������.
���� ��� �������� �������� �� �������� MIT �� GitHub.
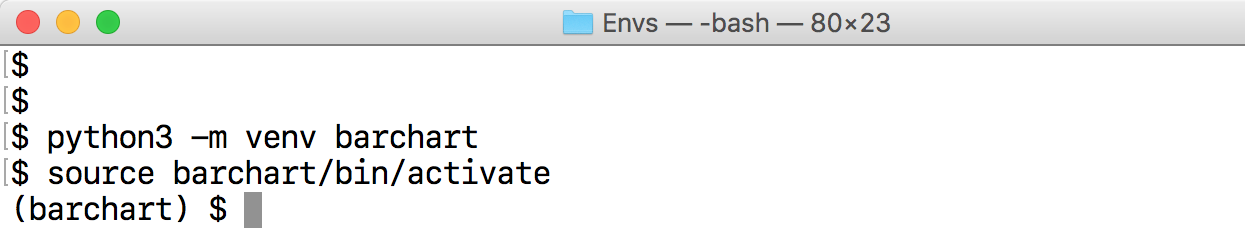
�������� ������ ����������� ��������� ��� �������. ��� �������, � �������� ��� ������� � ��������� ����� venvs, ��� ������� ��������� ��� ��� ����������� ���������.
python3 -m venv barchart����������� ����������� ���������.
source barchart/bin/activate����� ��������� ������������ ��������� ��������� ����������� ��������� ������:
�� ���������, ��� ��� ����������� ������������ ����������� ��������� � ������ ����� ���� ���������, �� �������� �� �������� ��������� ��� ����������.
������ ����� ���������� Bokeh � Flask � ��������� ����������� ���������. ��������� ��� �������, ����� ���������� Bokeh � Flask ���������� ������.
pip install bokeh==0.12.5 flask==0.12.2 pandas==0.20.1����� �������� � ��������� ����������� ���������� ����� �������� � ����������� ���������. ��������� �����, ����� ��������������, ��� �� ������������.
Installing collected packages: six, requests, PyYAML, python-dateutil, MarkupSafe, Jinja2, numpy, tornado, bokeh, Werkzeug, itsdangerous, click, flask, pytz, pandas
  Running setup.py install for PyYAML ... done
  Running setup.py install for MarkupSafe ... done
  Running setup.py install for tornado ... done
  Running setup.py install for bokeh ... done
  Running setup.py install for itsdangerous ... done
Successfully installed Jinja2-2.9.6 MarkupSafe-1.0 PyYAML-3.12 Werkzeug-0.12.2 bokeh-0.12.5 click-6.7 flask-0.12.2 itsdangerous-0.24 numpy-1.12.1 pandas-0.20.1 python-dateutil-2.6.0 pytz-2017.2 requests-2.14.2 six-1.10.0 tornado-4.5.1������ �� ����� ������� ��������������� � ������ ����������.
�� ������� ������� Flask-���������� � ������� ���������� ��������� �� ��������.
�������� ����� ��� ������ ������ � ������ app.py � ����� �����������:
from flask import Flask, render_template

app = Flask(__name__)

@app.route("//")
def chart(bars_count):
    if bars_count <= 0:
        bars_count = 1
    return render_template("chart.html", bars_count=bars_count)

if __name__ == "__main__":
app.run(debug=True)��� ������� Flask-����������, � ������� ���� ������� chart. chart ��������� ����� �����, ������� ����� ����� �������������� ��� ����������� ���������� ������ ��� ���������. ������� render_template ������ chart ����� ������������ ������������ Jinja2 ��� ��������� HTML.
��������� 2 ������ ��������� ��� ��������� ���������� �� ������� �� 5000 ����� � ������ �������. ������� �� ����������� ����� ������� � ����������, ��� ����� ���������� WSGI-������� ����� Gunicorn.
�������� ����� templates ������ ����� �������. ������ �� �������� ���� chart.html. �� ����� ������� chart �� app.py, ������� ��� ���� ���������� �� ����� �������� ���������. ��������� chart.html Jinja2-���������.
Bugs found over the past {{ bars_count }} days
��������� chart.html ����� ���������� ���������� ��������, ���������� � ������� chart ����� URL.
��������� ������ ���� h1 �������� ���� ������ ����������. �� ����� ������� ������ ���������� �����, ��������� �������� ��������������� ������������ �� ������ ����.
������ �� ����� �������������� ���� ����������.
���������, ��� ����������� ��������� �� ��� ������� � �� ���������� � ����� � app.py. ��������� app.py � ������� ������� python.
$(barchart) python app.py��������� �� localhost:5000/16/. �� ������ ������� ������� ���������, ������� ��������, ����� �� ������� URL.

���� ���������� ��� �����������, �� ���� �� ����������. ������ ����� �������� ������.
��� ����� ����� ���� �������� ������� ����, ������� ����� ������������ Bokeh.
�������� app.py � �������� � ���� ������ ������.
import random
from bokeh.models import (HoverTool, FactorRange, Plot, LinearAxis, Grid,
                          Range1d)
from bokeh.models.glyphs import VBar
from bokeh.plotting import figure
from bokeh.charts import Bar
from bokeh.embed import components
from bokeh.models.sources import ColumnDataSource
from flask import Flask, render_template��������� ����� ����� ����� ������������ Bokeh ������ � ������� random ��� ��������� ������ � ���������� ���������.
������ ��� ��������� ����� �������������� ������ ��� ������ ������������ ��������. � �������� ���������� ����������� ����� ������� � �������� �������� ������!
����������� �������� app.py. ��� ����� �������� ������ ��������� ��������� �������.
app = Flask(__name__)

@app.route("//")
def chart(bars_count):
    if bars_count <= 0:
        bars_count = 1

    data = {"days": [], "bugs": [], "costs": []}
    for i in range(1, bars_count + 1):
        data['days'].append(i)
        data['bugs'].append(random.randint(1,100))
        data['costs'].append(random.uniform(1.00, 1000.00))

    hover = create_hover_tool()
    plot = create_bar_chart(data, "Bugs found per day", "days",
                            "bugs", hover)
    script, div = components(plot)

    return render_template("chart.html", bars_count=bars_count,
the_div=div, the_script=script)������� chart ����������� ������ � ������� � ������� ����������� ������ random.
chart �������� 2 �������: create_hover_tool � create_bar_chart. �� ���� �� �������� ��� �������, ������� ��������� ��������� ��� ����� ������� chart:
def create_hover_tool():
# ��� ������� �� ������� ���� �����
return None
def create_bar_chart(data, title, x_name, y_name, hover_tool=None,
width=1200, height=300):
"""������ ���������� ���������.
��������� ������ � ���� �������, ������� ��� �������,
�������� ���� � ������ ��������� ��� ���������.
"""
source = ColumnDataSource(data)
xdr = FactorRange(factors=data[x_name])
ydr = Range1d(start=0,end=max(data[y_name])*1.5)
tools = []
if hover_tool:
tools = [hover_tool,]
plot = figure(title=title, x_range=xdr, y_range=ydr, plot_width=width,
plot_height=height, h_symmetry=False, v_symmetry=False,
min_border=0, toolbar_location="above", tools=tools,
responsive=True, outline_line_color="#666666")
glyph = VBar(x=x_name, top=y_name, bottom=0, width=.8,
fill_color="#e12127")
plot.add_glyph(source, glyph)
xaxis = LinearAxis()
yaxis = LinearAxis()
plot.add_layout(Grid(dimension=0, ticker=xaxis.ticker))
plot.add_layout(Grid(dimension=1, ticker=yaxis.ticker))
plot.toolbar.logo = None
plot.min_border_top = 0
plot.xgrid.grid_line_color = None
plot.ygrid.grid_line_color = "#999999"
plot.yaxis.axis_label = "Bugs found"
plot.ygrid.grid_line_alpha = 0.1
plot.xaxis.axis_label = "Days after app deployment"
plot.xaxis.major_label_orientation = 1
return plot����� ����� ����, � ������� ����� �����������. ������� create_hover_tool ���� ������ ���������� None, ������ ��� ���� ��� �� ����� ���������� ��������� ��� ���������.
������ ������� create_bar_chart �� ����������� ��������������� ������ � ������ ���� ColumnDataSource, ������� �� ����� �������� �� ���� �������� Bokeh ��� ���������� �������. �� ����� ��������� ���� x � y.
���� � ��� �� ��������� ��������� ��� ���������, ������ tools ����. ��� ����� ���������� � ������ ������� figure. �� ������� �� �� ����������� ��� ���������� �������: ������, ������ ������������, �������, ��������� ��������� ������� ��� ��������� ������� ���� ��������.
�� ������ ������������ ������� � ������� ������ VBar � ��������� �� �� ������ � ������� ������� add_glyph, ������� ����� �������, �� ������� ������ ������������ � �������.
��������� 2 ������ �������� ���������� �������. ��� ������� � ����� ������� Bokeh ��� ������ plot.toolbar.logo = None � ������� ������� � ����� ����. � ���������� ������� ������������ bokeh.plotting ����� �������, ����� �����, ��� ����� ��������������� ������������.
��� ����� ������� ����� ���� ��������� � ����� templates/chart.html, ����� ���������� ������. �������� ���� � �������� ��� ���������� ���������.
    Bugs found over the past {{ bars_count }} days
    {{ the_div|safe }}


    {{ the_script|safe }}
2 �� 6 ����������� ����� ����� ��� �������� CSS-������ Bokeh, ��� 2 ��� �������� ��� ��������, � ��� 2 � ��� ��������� �������.
�� ������, ������� �������� ���� ����������. Flask ������ ������������� ������������ ����������, ����� �� ��������� ��������� � app.py. ���� �� ���������� ���-������, �� ������ ����� ��� ��������� �������� python app.py.
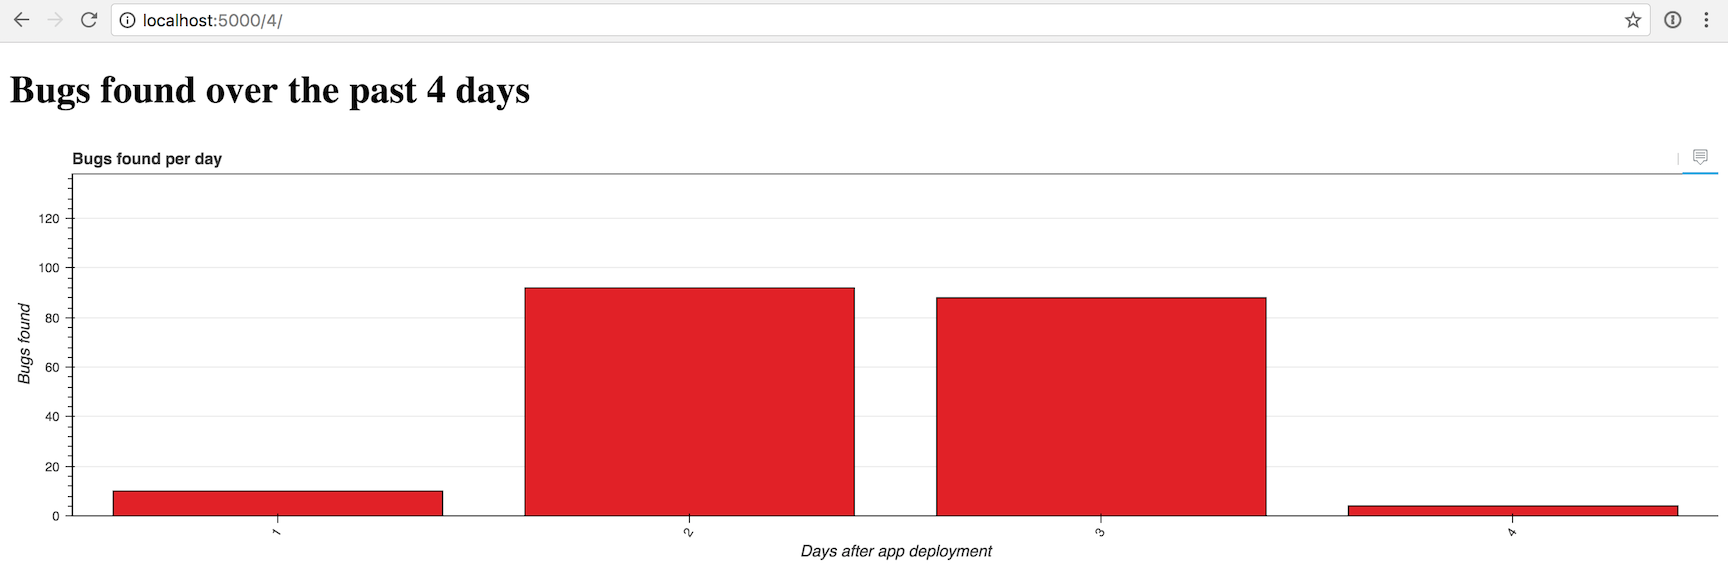
�������� � �������� localhost:5000/4/.
�������� ������� �����, �� �� ����� �������� ���������� �������� �� 16, ���� ������� �� /localhost:5000/16/.
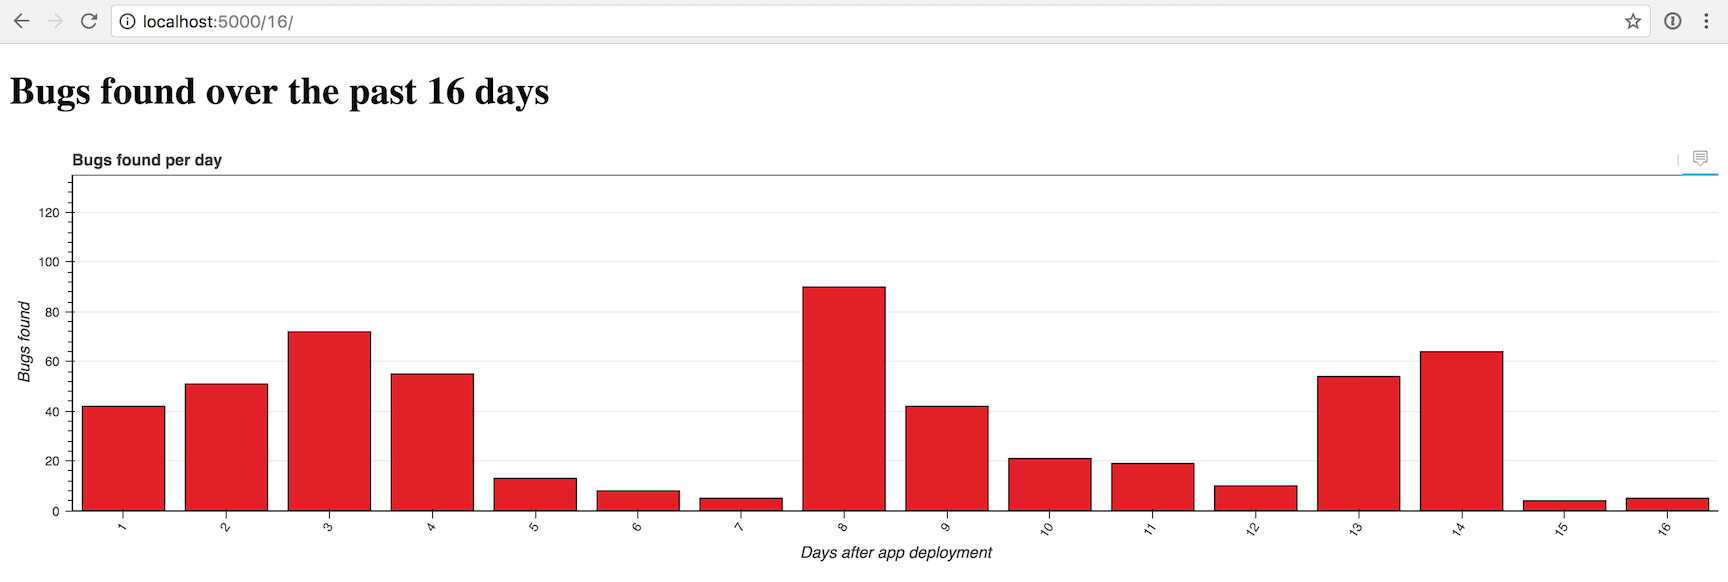
��� � 4 ���� ������...
�������� �������� �������. �� ���, ���� �� ������� ��������� ��� ���������, ����� ����� ���� �������� ������� ������ �������? ����� �������� ���������, ��� ����� �������� ������� create_hover_tool.
������ app.py �������� ������� create_hover_tool
def create_hover_tool():
    """Generates the HTML for the Bokeh's hover data tool on our graph."""
    hover_html = """

        $x


        @bugs bugs


        $@costs{0.00}

    """
return HoverTool(tooltips=hover_html)����������� HTML � ���������� �� Python ����� ���������� �������� ��������, �� ������ ��� �� ���������� ��� ���������. �� ���������� $x, ����� �������� x-���������� �������, @bugs, ����� �������� ���� "bugs" ��������� ������ � $@costs{0.00}, ����� �������� ���� "costs" ��� ���� � 2 ������� ����� �������.
���������, ��� �� �������� return None �� return HoverTool(tooltips=hover_html).
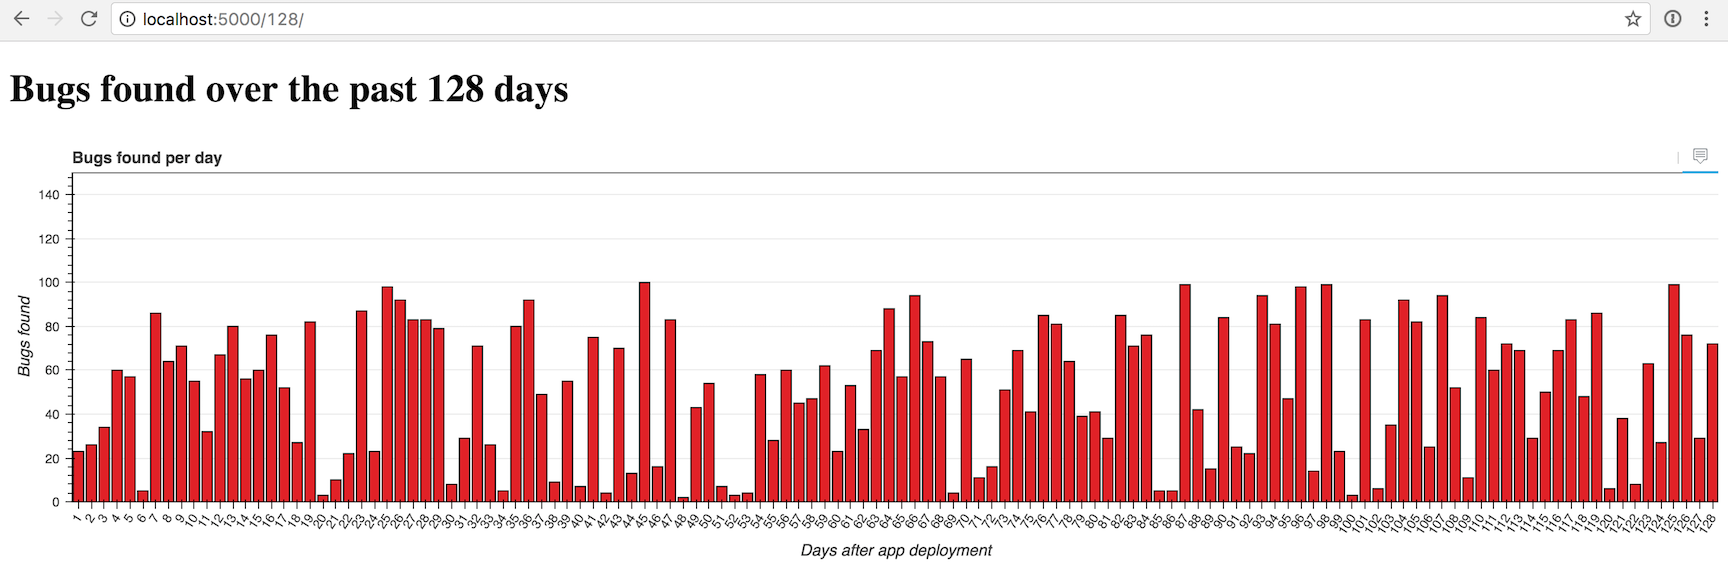
��������� � ������� � ������������� �������� localhost:5000/128/.
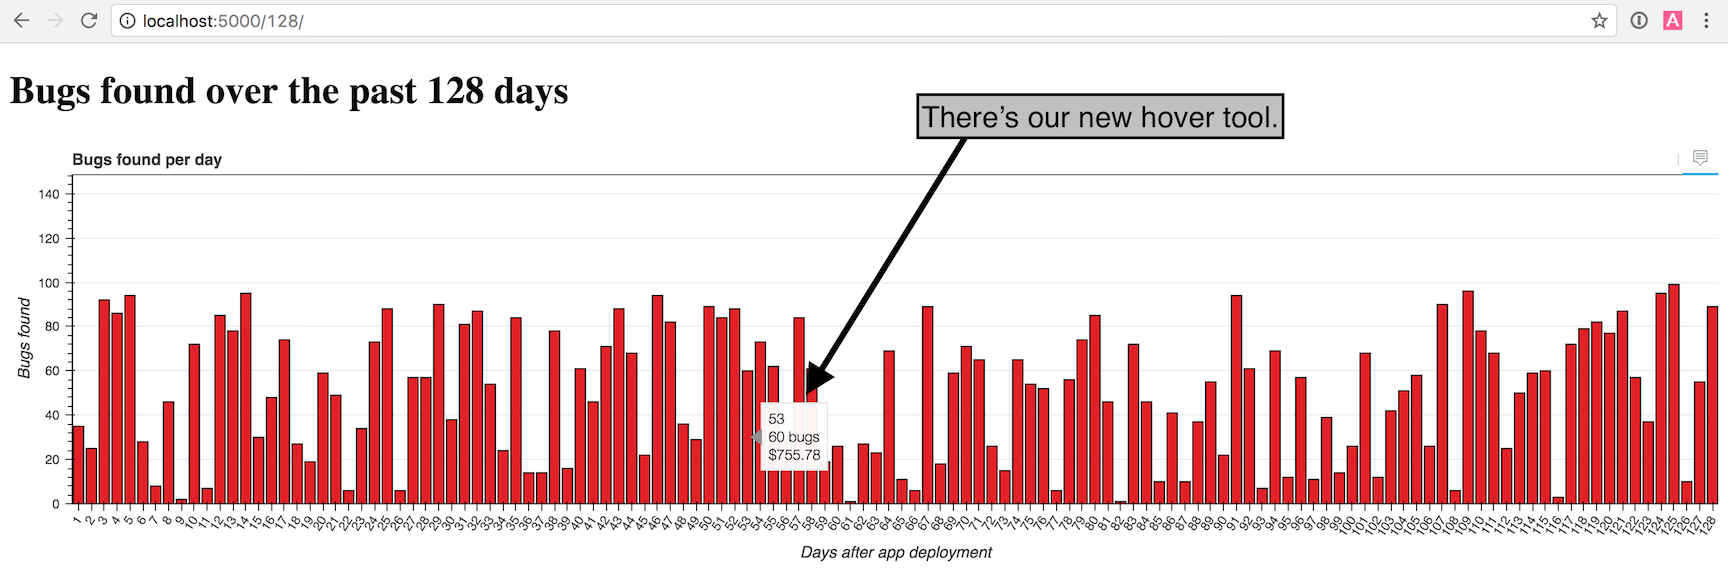
�������� ������! ���������� �������� � ����������� �������� � URL � ���������� ��� ������ ����� ���������.
������ �������� ����������� �������� ��� 100 ��������, �� �� ������ ����������� ������ ����� ��������. �� 50,000 ���������� �������� �������:
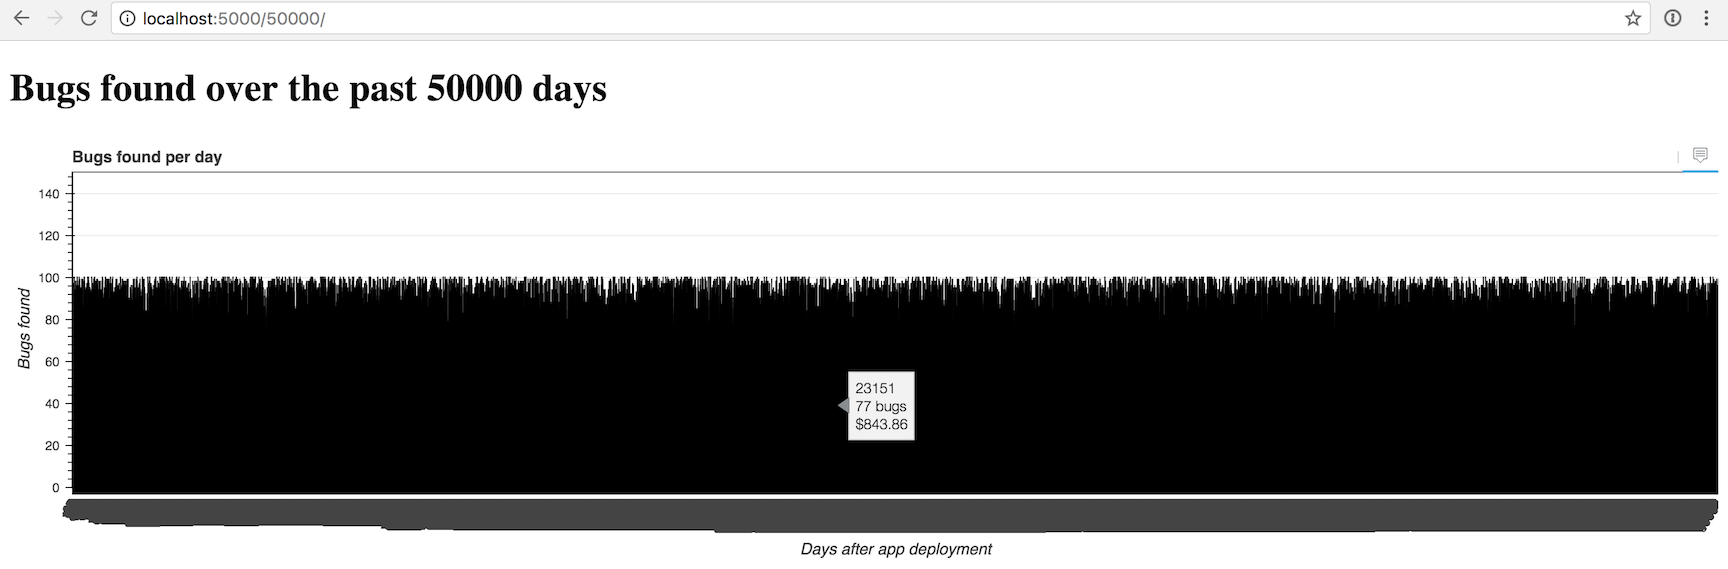
�� ��, ������, ��� ����� ������� ��� ���-��, ����� ����� ���� ���������� ������ ���� ����� �������� �� ���.
�� ������� �������� ������ �� Bokeh. ����� �� ������ �������� �������� �����, ���������� ������ �������� ������, ����������� ������ ���� �������� ��� ���������, ��� ���������� �������� ������ ������.
� ������� Bokeh ����� ������ ������� ������, ��� ��� ����� ���������� ����������� ������������, ����������� �� GitHub, ��������� Bokeh �� Full Stack Python.
���� �������? ������� ��� �� ����� GitHub ���� ����� Twitter @fullstackpython ��� @mattmakai.
| �������������� | « ����. ������ — � �������� — ����. ������ » | ��������: [1] [�����] |


