Mozilla Performance Blog: Performance Tools Newsletter (H1 2021) |
As the Perf-Tools team, we are responsible for the Firefox Profiler. This tool is built directly into Firefox to understand the program runtime and analyze it to make it faster. If you are not familiar with it, I would recommend looking at our user documentation.
If you are curious about the profiler but not sure how to get to know it, I’ve also given a FOSDEM talk about using the Firefox Profiler for web performance analysis this year. If you are new to this tool, you can check it out there.
During our talks with the people who use the Firefox Profiler frequently, we realized that new features can be too subtle to notice or easily overlooked. So we’ve decided to prepare this newsletter to let you know about the new features and the improvements that we’ve made in the past 6 months. That way, you can continue to use it to its full potential!
ChromeUtils.addProfilerMarker APISo, let’s get started with the new features.
In the DevTools panel, we still had the old performance tab. That tool was pretty old and not very well maintained for a while. The new Firefox Profiler is a lot more comprehensive compared to the old tool. We aim to make it the new default one. We’ve hit a big milestone and enabled it in the Firefox Dev Edition. We are hoping to get rid of the old panel soon. Thanks to Nicolas Chevobbe and Julian Descottes from the DevTools team for helping out on this!
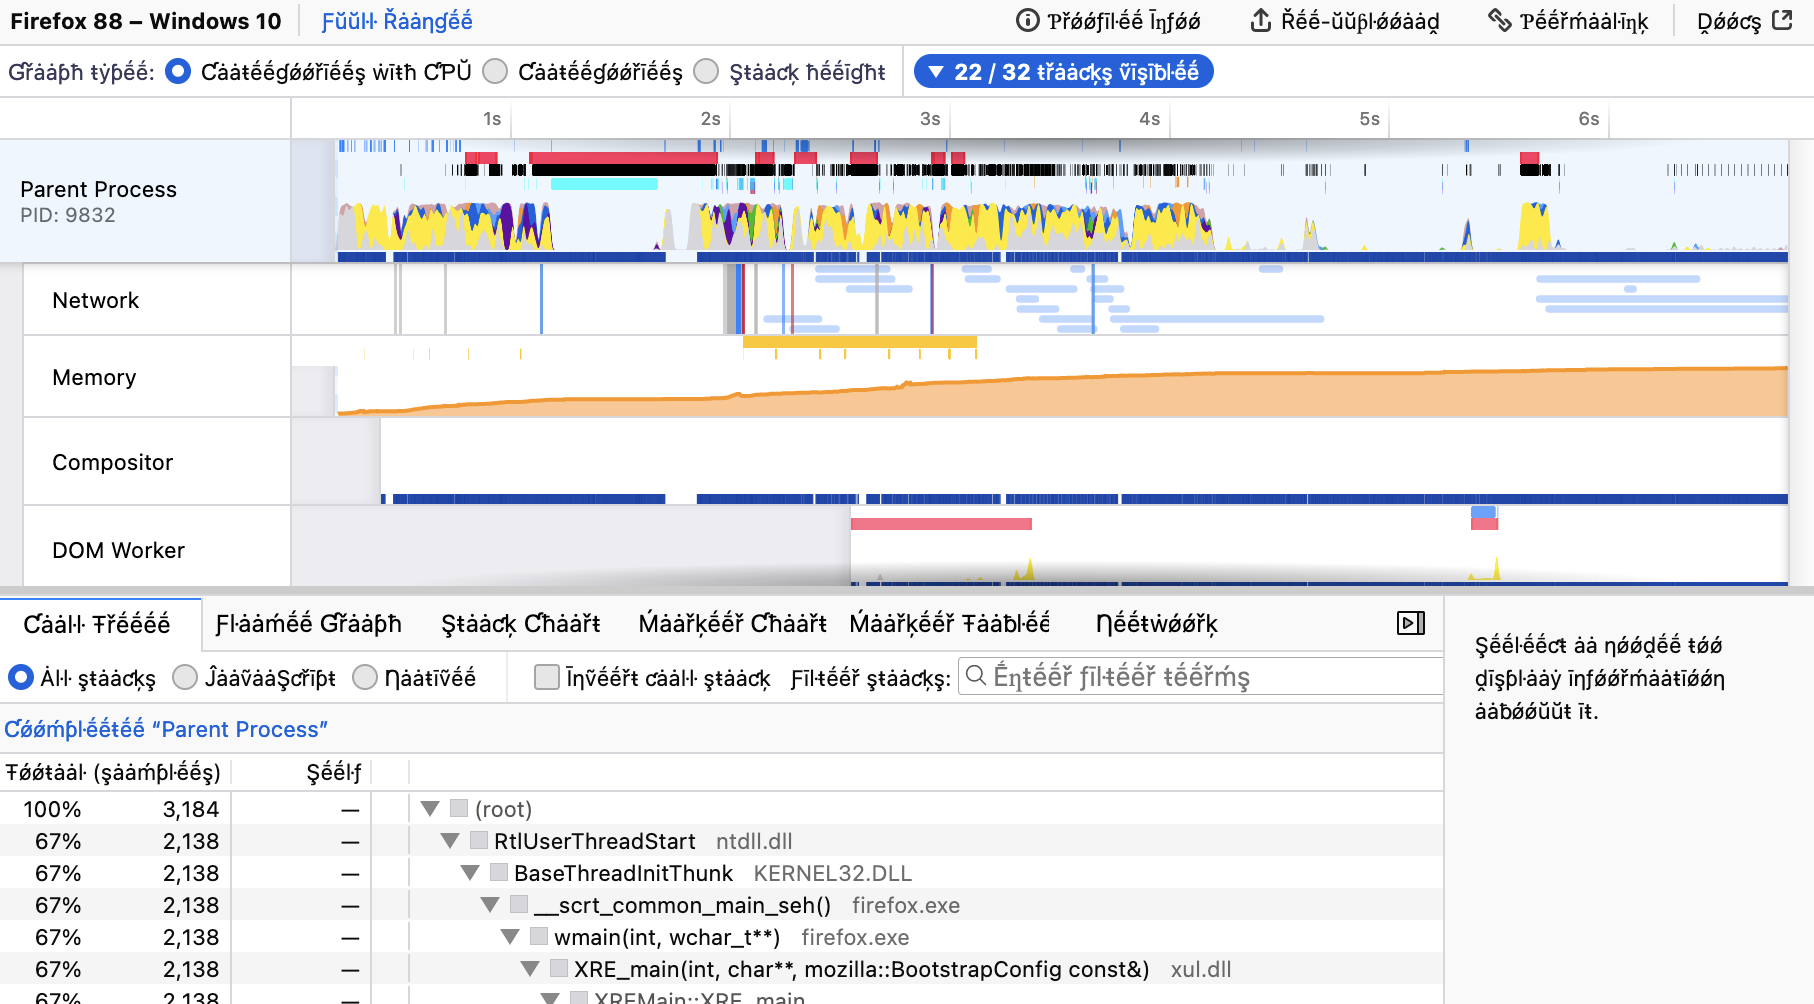
Previously, the height of the activity graph (the graph in the pictures) wasn’t directly tied to the actual amount of work done: We were setting the height to 100% when we saw a non-idle sample there, and then applying some smoothing. But now, we collect the CPU usage information from Firefox and then draw the height of this graph to match the CPU usage of this thread. This allows our users to see which part of the thread is using more CPU and which part of the thread is using less. This is important because our users were thinking that the height actually meant CPU usage already, but it wasn’t the case before. So, it’s good to match our users’ expectations in this case.
This new implementation also gives us information about the places where the Firefox is unresponsive but the thread is not using any CPU. In this case, it can mean that the thread is blocked.
When the graph height is not so high, except waiting for another thread, it can also mean that, either the thread is waiting on disk to write/read a lot, or the whole system is working on a heavy task and not giving Firefox enough CPU time to run.. Previously, it wasn’t possible to figure these cases out, but thanks to the CPU usage information, we can now understand it by looking at a profile.
Here are two example profiles. Both are from a startup of Firefox, but the first one is a warm startup, whereas the second one is a cold startup. You will notice easily that the graph height on the cold startup is a lot lower compared to the warm one. This is because on cold startups, we are reading a lot of data from the disk, and the reference laptop we used to capture these profiles has a slow disk:
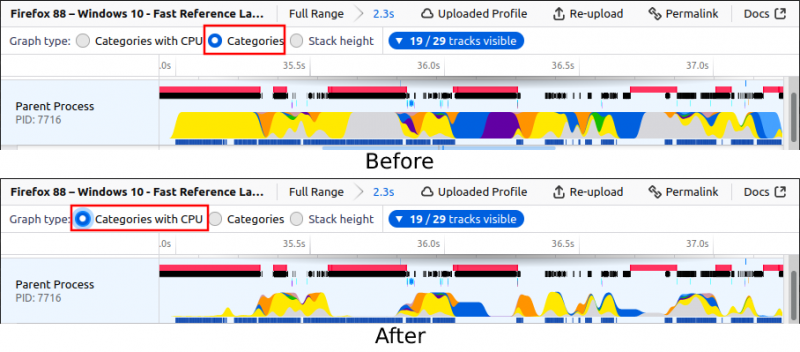
Now we have “Categories with CPU” as a graph type. You can see that the graph is different now when CPU usage numbers differ.
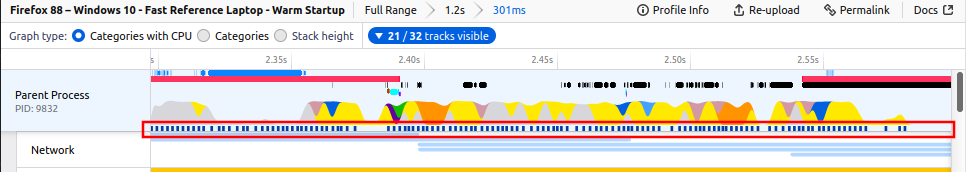
With the previous CPU utilization work, we also added another graph underneath the activity graph. As visible in the image below, you can now see the exact locations of the samples in this graph. You can also click on them to select that sample’s stack. With this graph, it’s also possible to see where we have missing samples. Missing samples usually mean that the profiler can’t keep up with the sampling. It’s good to note that we don’t know exactly what’s happening in these areas of the timeline. You can try to reduce the overhead of the profiler if you have so many missing samples, for example by increasing the sampling interval, because the profile data you captured will not be as reliable when the profiler can’t sample regularly enough.
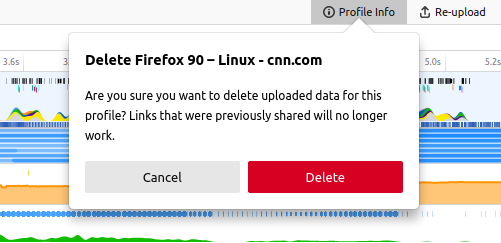
You can find it inside the “Profile Info” popup on the top right corner if you uploaded that profile. Previously we added this page to manage your uploaded profiles. But adding the delete button to the analysis UI was also important, so you can directly delete the profile that you easily uploaded. We keep a key in your browser’s local storage to know that you uploaded that profile data. So, to be able to delete it, you need to use the same browser that you uploaded it from.
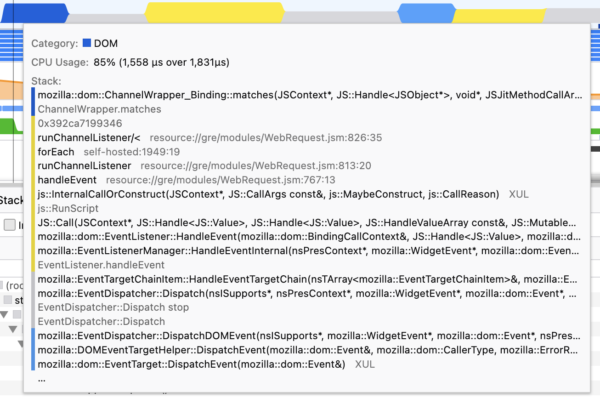
This is a small but a nice addition. We have stacks in tooltips, the marker table and the sidebar. Previously, it wasn’t possible to figure out which function belongs to which category. But with this change, you can now see their category colors on their left side. This gives you a quick overview of what’s happening in this stack.
Gecko Profiler didn’t have a canonical Rust API. We had some hacks for multiple Rust projects, they were all similar but with subtle implementation differences. If you wanted to use profiler API functions in a new Rust project, you had to write everything again and again. We’ve decided to make a canonical Rust crate for the profiler, so people who work on Rust code can easily import and start using it immediately. We’ve landed the first part of this API now, which is about thread registration.
If you are working on a Rust project with multiple threads, don’t forget to register your threads with the Gecko Profiler. After registering them, you will be able to profile them by adding the thread names (or part thereof) to the custom thread names input in about:profiling. It’s pretty straightforward to register them with gecko_profiler::register_thread and gecko_profiler::unregister_thread.
More Rust API functions for the profiler are coming soon!
Our Outreachy intern Hasna Hena Mow (CipherGirl) has worked on the internationalization of the profiler.firefox.com. And thanks to her, this project is complete now! The actual translation process is happening now.
That’s also one of the nice usability improvements. Previously, it wasn’t possible to see the screenshots while selecting a time range. That was a bit annoying, because screenshots are good indicators of what’s happening at that time, and they are usually good indicators when selecting a time range as well. So, now you can see them while selecting a range!
You can now import Android trace format to Firefox Profiler analysis UI easily. Just drag and drop the .trace file into firefox.profiler.com, it will import and open the profile data automatically without any additional steps. You can also open it using the button “Load a profile from file”.
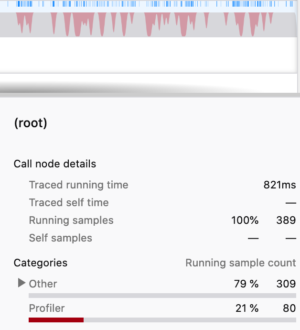
We’ve added a new category to show the profiler overhead. This is a pretty interesting indicator that we didn’t have before, because this is actually showing us how much the profiler itself is affecting the profile that we are capturing. So after capturing a profile, if you see a lot of red categories in the timeline, it usually means that the profiler is working too much and possibly skewing the data you are capturing. In this case, you can try to reduce the overhead of the profiler by going to the about:profiling page and increasing the interval or disabling some of the features.
Another small feature to quickly make all the tracks visible! Quite handy when you have a lot of tracks and don’t know what you are looking for.
Y tracks visible" button." class="aligncenter size-full wp-image-202" height="276" src="http://blog.mozilla.org/performance/files/2021/07/show-all-tracks.png" width="1610" />
Our network markers weren’t always reliable, especially when it comes to service workers. They were mostly marked as “unfinished markers” and not being displayed in the front-end due to lack of correct recording. We’ve made a lot of improvements to make them record properly and in the correct places. Some more fixes are coming in this area.
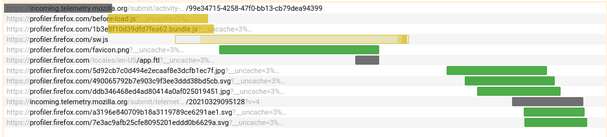
New network markers that belong to a service worker inside the “Network” tab.
This was another big task we wanted to fix for a while. Sometimes, when a stack included JIT (Just In Time-compiled JavaScript) frames, it would fail to find their native calling functions, causing a large number of samples to appear in separate locations from where they should have been. The Profiler can now use JIT information to correctly restart stack walking when needed. It’s a platform-dependent task, and only 64-bit Windows is fixed for now. macOS fixes are in review and will land soon, with other platforms to follow in the coming months.
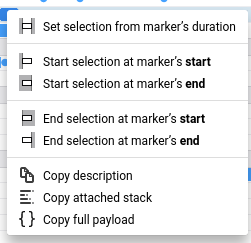
We display context menus in various places. And inside the Marker Chart and Marker Table panels, we are displaying the marker context menu. Previously, it wasn’t really easy to understand and find the item that you want to click, even for people who are used to the profiler. Now, it’s a lot easier to understand and find the item you want to click with better wording, icons, and bold texts where necessary.
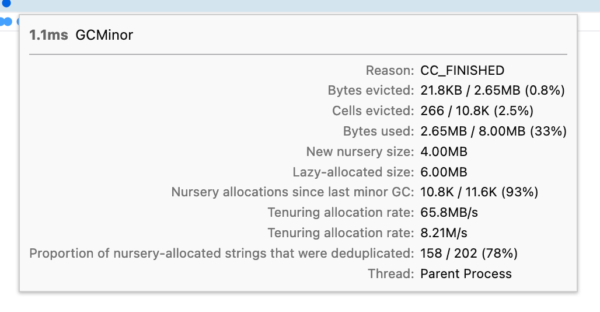
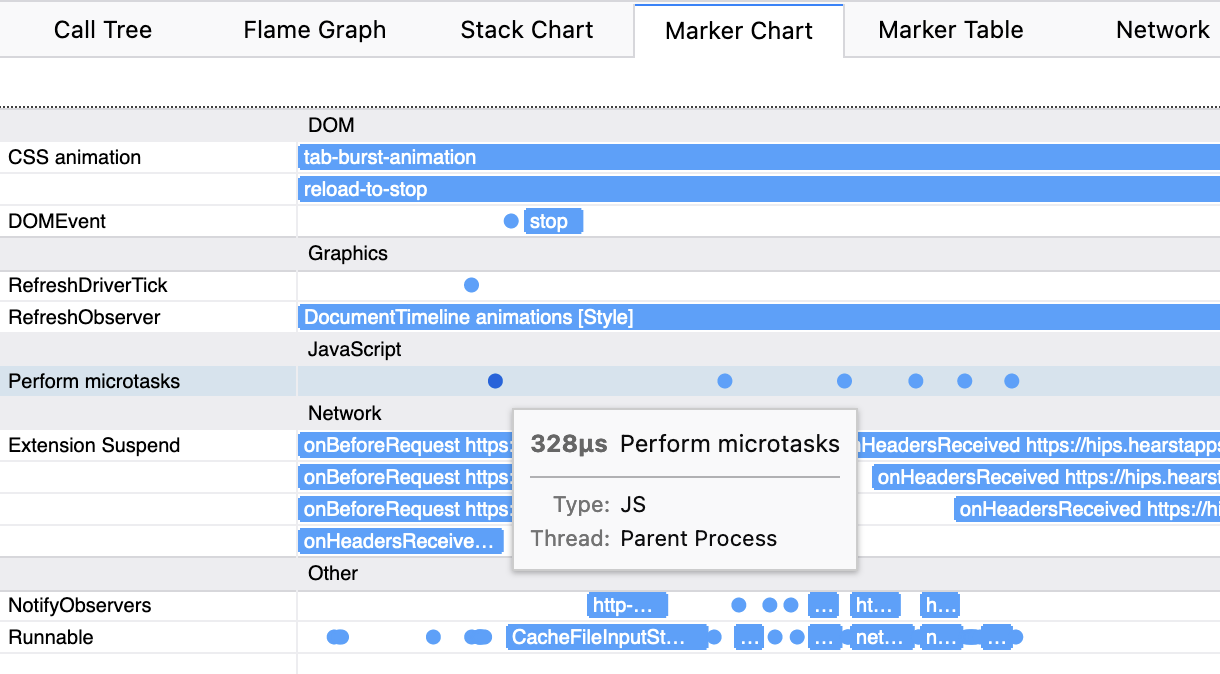
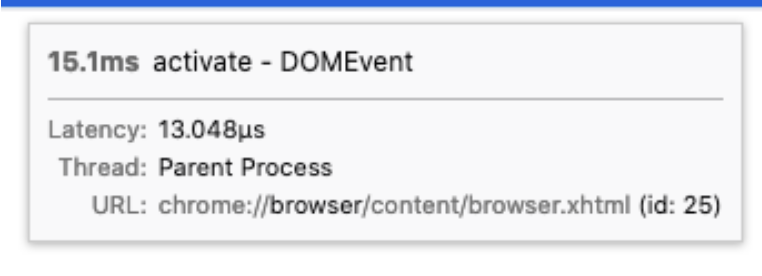
ChromeUtils.addProfilerMarker APIYou may know the ChromeUtils.addProfilerMarker API for capturing a profiler marker from JavaScript. With this change, this API now supports capturing a stack and adding a category to them. Capturing a stack is important when you need to know the cause of an event. This will show up on the marker tooltips in the analysis UI. Similarly, categories will show up on the marker’s tooltip in the Marker Chart, and in the sidebar in the Marker Table.
We had the network track for the visualization of the network markers. Previously it was only showing you where a network request starts and ends, but to be able to see more, you had to switch to the “Network” tab. Now you can directly hover over any network request in this track and it will show you the information about it in a tooltip. More improvements are coming in this area!
We have a profile info button on the top right corner of the analysis page. When you click on this button, we open the Profile Info panel where we display the metadata that were gathered from Firefox. This metadata includes profile related information like recording time and settings, application information like Firefox version and build ID and platform information like OS, ABI and CPU. We got some feedback about this button not being very visible and explicit. Now, it is.
Before:
 After:

This is a small usability improvement for Android folks. It’s in the panel we discussed in the previous improvement. Previously, it was possible to see the Android version, ABI and CPU information in the Platform section. But it wasn’t possible to see the device name which is pretty important most of the time. Now, you can see that in the Profile Info panel on the top right corner.
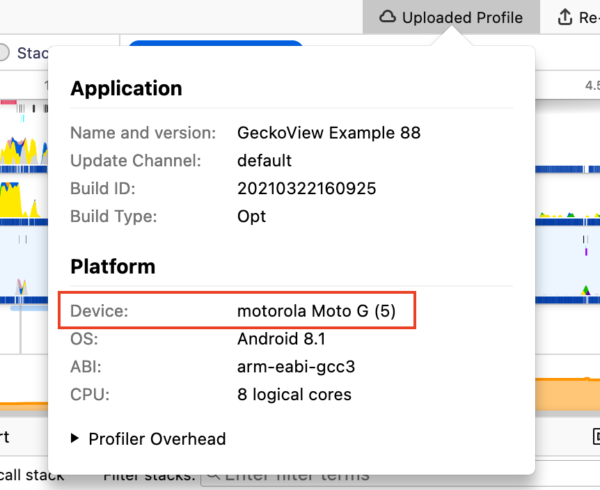
You can see that information under the “platform” section inside Profile Info panel.
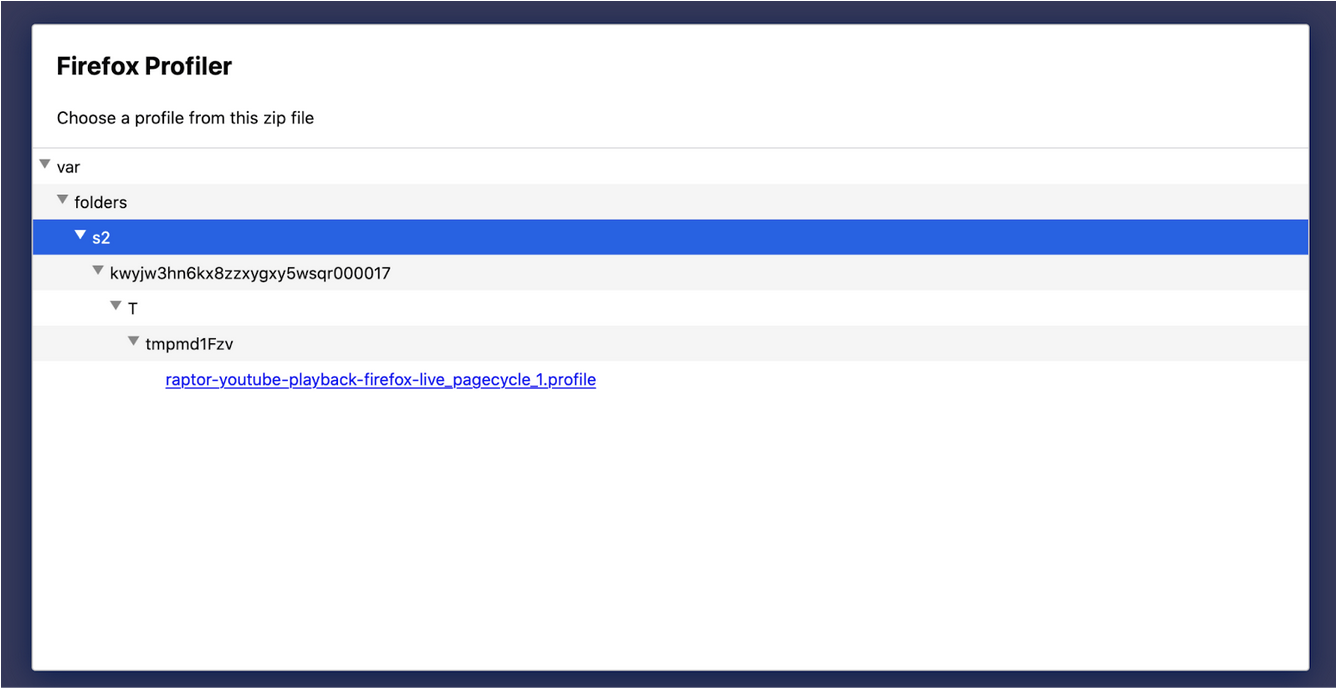
This is another usability improvement. When you open profile data from a zip file (like the ones from treeherder) it’s not always easy to find the profile data you want. Especially because treeherder puts the profile files in a folder that’s buried under some other folders. Now it will be just a click away, because zip file viewer now expands all the children.
When JavaScript code calls an XPIDL method/getter/setter, we weren’t doing a good job showing this. Now, with the new label frames you can see them easily, and with a category change as well. It’s similar to what we already had for WebIDL.
A recent Profiler buffer change was affecting the memory track and was making it hard to see small memory changes unrelated to the Profiler (which typically uses 1MB chunks). With this change, it’s now possible to see these small changes.
The Network Chart panel is more usable with only a keyboard now!
Less places to potentially break on Tier-3 platform builds! We are still incrementally working on reducing the MOZ_GECKO_PROFILER ifdefs to make our and our users’ life easier.
We’ve talked about the things we did so far. There are also so many things we still would like to do. I want to mention some of them here as well, in case you are curious. It’s not going to be a complete list, but at least it can give you some ideas about the direction we are heading as the Performance Tools team.
There is some unfinished work we would like to finish. Like shipping the Firefox Profiler in DevTools panel (also known as the unified profiler project), finishing the JIT stack walking fixes, landing more Rust Profiler APIs. But we also want to work on some new things like: Reducing the overhead of the profiler, making it easier to find unregistered threads and better support for profiling with many threads, making the IPC markers better, collecting CPU usage of all threads and/or processes, making a lot more usability improvements and polishes.
If you also have something on your mind about the things we can improve, please let us know!
Thanks for reading this far! It’s been a busy first half in 2021 and we intend to continue making the Firefox Profiler better with the things I discussed in the previous section. If you have any questions or feedback, please feel free to reach out to me on Matrix (@canova:mozilla.org). You can also reach out to our team on Firefox Profiler channel on Matrix (#profiler:mozilla.org).
If you profiled something and are puzzled with the profile you captured, we also have the Joy of Profiling (#joy-of-profiling:mozilla.org) channel where people share their profiles and get help from the people who are more familiar with the Firefox Profiler. In addition to that, we have the Joy of Profiling Open Sessions where some Firefox Profiler and Performance engineers gather together on Zoom to answer questions or analyze the profiles you captured. It’s usually happening every Monday, and you can follow the “Performance Office Hours” calendar to learn more about it.
https://blog.mozilla.org/performance/2021/07/08/performance-tools-newsletter-h1-2021/
| Комментировать | « Пред. запись — К дневнику — След. запись » | Страницы: [1] [Новые] |


