Luke Wagner: asm.js AOT compilation and startup performance |
With the recent announcement of a commercial game shipping using Emscripten and asm.js, I thought it’d be a good time to explain how asm.js is executed in Firefox and some of the load-time optimizations we’ve made since the initial landing of OdinMonkey in March. (OdinMonkey is an optimization module inside Mozilla’s JavaScript engine.) There have also been significant throughput optimizations as well, but I’ll stick to load time in this post.
Measuring the Epic Citadel demo (based on the same Unreal Engine 3 inside Monster Madness), I see a 2x improvement:
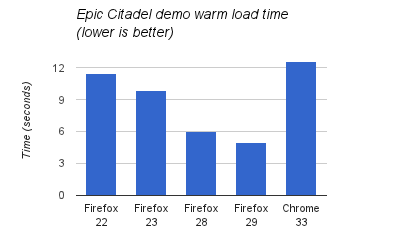
Times were measured with a simple stopwatch up to the first animation frame on a 16x2.4Ghz core Linux machine. (An IndexedDB bug in either the demo or Chrome causes level data not to be cached so time in “Downloading data” is explicitly subtracted from Chrome’s time.)
Cold load time improvements on the Citadel demo are harder to see since network latency plays a much larger part and adds considerable variance. Measuring the Nebula3 demos instead, which have a smaller initial download size and are compiled with both Emscripten and PNaCl, we can also see significantly better load times:
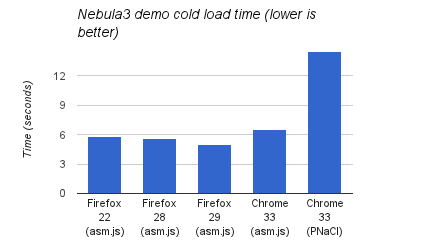
Times were again measured with a simple stopwatch up to first animation frame.
In this blog post I’ll explain the compilation strategy we use for asm.js, why we decided to try this strategy, how it’s been working, and 3 optimizations that have had a significant impact on load time.
The post is a bit long, so here’s the TL;DR:
Before getting into how we compile asm.js, let’s look at a diagram of the path taken by normal JavaScript in SpiderMonkey (Mozilla’s JavaScript engine). In this diagram, boxes are data structures and arrows represent algorithms which consume and/or generate these data structures:

In short, units of code (like functions, eval scripts, and global scripts) start as a bunch of characters in memory and gradually get compiled into forms that are able to execute more efficiently. While each unit of code starts the same way, different units of code will move along the arrows of this diagram at different times as they are run and judged hot enough. This compilation strategy is generally called Just-In-Time (JIT) compilation.
Going into a little more detail on the labels in the digram:
Given this whole process, it’s reasonable to ask: why do we need all these tiers of execution? To wit, V8 has two tiers, and Apple’s JSC has three and is experimenting with a fourth. Thus, this strategy is common (although people are always looking for something simpler). There are two main reasons we’ve found in SpiderMonkey for this tiered structure.
One reason is that SpiderMonkey has to run many different types of code and most code doesn’t run long enough to amortize the cost of compilation. In fact, most code doesn’t even run once which is why SpiderMonkey and other JS engines wait for a function to be run before even fully parsing it. Of code that is run, most doesn’t get warm enough to Baseline-compile and, similarly, most warm code doesn’t get hot enough to Ion-compile. Thus, each tier of execution services a distinct type of workload.
The other reason is that the Ion-build step actually depends on code having warmed up in Baseline so that the profiling metadata is likely representative of future execution. Ion compilation uses this metadata to specialize the types of values, objects, operations, etc which it could not do based on static analysis of the code alone.
What’s great about this design is that it has allowed continual progress by modern JavaScript engines on all kinds of JavaScript code. This progress continues today in all the major JS engines without signs of letting up.
As it became clear that Emscripten was a big deal (remember the H.264 decoder?), we started to try it out on bigger codes and talk with potential users. As we did this, one thing that became clear: if the web was going to be a serious porting target for large, computationally-intensive apps, we needed performance to be predictable. Now, even with native code, performance is never truly predictable due to things like dynamic scheduling and cache hierarchies. However, with Emscripten output, we were seeing some pretty violent fluctuations in startup and throughput on differnet codes and on different browsers.
Analyzing these fluctuations, we saw several causes:
Each of these problems can potentially be mitigated by adding new JIT compilation techniques and heuristics. Indeed, we’ve seen a lot of improvement along these lines in the V8 and SpiderMonkey JIT compilers in the last year and I expect to see more in the future. For example, in both JIT compilers, a few heuristic tweaks provided large throughput improvements on the asmjs-apps benchmarks on arewefastyet.com and background JIT compilation has helped to significantly reduce JIT compilation pauses.
However, the question is: to what extent can these problems be mitigated? Unfortunately, that’s hard to know a priori: you only really know when you’re done. Furthermore, as with any heuristic tuning problem, it’s easy to measure on workloads A, B and C only to find afterwards that the fixes don’t generalize to workloads D-Z.
In broader terms: with the proliferation of walled gardens and the consequent frustration of developers, the Web has a great opportunity to provide an open, portable alternative. But to really be an alternative for many types of applications, the web needs predictable, near-native performance. The time is ripe, so we don’t want to miss the opportunity by blocking on a Sufficiently Smart Compiler.
To attempt to solve the above problems, we started the OdinMonkey experiment. The basic idea behind the experiment was: Emscripten-generated code has enough type information preserved from the original statically-typed source language that we can avoid all the dynamic-language compilation infrastructure and use a simple Ahead-of-Time (AOT) compiler.
For example, given the following C code:
int function f(int i) {
  return i + 1;
}
Emscripten would output the following JS code:
function f(i) {
  i = i|0;
  return (i + 1)|0;
}
The statement “i = i|0” effectively performs the JS spec ToInt32 on the input, ensuring that + always operates on an integer. If we can prove that all callers pass ints, then this coercion is a no-op. The expression “(i + 1)|0” exactly simulates 2s complement addition meaning that this JavaScript expression compiles to a single machine instruction — no type tests, no overflow checks.
If you squint your eyes at the above code, you can view “i = i|0” as a parameter type declaration, “return (...)|0” as a return type declaration and binary + as taking two int types and returning a special type which requires coercion via ToInt32 or ToUint32 before use. This basic idea of viewing runtime coercions as types can be extended to all statements and expressions in Emscripten-generated code and the resulting type system is asm.js.
Given the asm.js type system, OdinMonkey is easily able to generate MIR from the AST. As an example, check out the CheckNot function in OdinMonkey (which checks the ! operator): as input it receives a ParseNode (an AST node) and, as output, it returns an MNot MIR node and the expression’s result type (which according to the spec is int). If any of the types fail to match, a type error message (like you’d expect from a C compiler) is output to the Web Console and OdinMonkey transparently falls back to normal JS compilation.
In terms of the previous JIT compilation diagram, OdinMonkey adds a single new arrow between AST and MIR:

Furthermore, after asm.js type checking succeeds (as well as the link-time check), it is not possible for the generated code to take the Bail edge: there are no dynamically-checked assumptions that can fail.
In addition to simplifying the compilation process, the asm.js type system also provides three broader benefits:
Despite all these advantages, AOT has a significant potential downside: it compiles everything using the most expensive compiler without knowing if the code being compiled is hot or cold. This would obviously be a problem if an app contained a lot of cold or dead asm.js code. Similarly, AOT would be a net loss for an app with a lot of code that runs in short bursts so that low tiers of execution and compilation stalls aren’t noticeable. Thus, the load-time performance of AOT relative to JIT depends on the kind of code being executed.
Another potential pitfall for AOT is pathologically-large functions since these can take a really long time to compile in the top-tier compiler. With JIT compilation, the usual heuristics ensure that the top-tier compiler is never used. With some work, OdinMonkey could be extended with heuristics do the same. In the meantime, Alon added an “outlining” option to Emscripten that automatically breaks up large functions and has been quite effective. By making functions smaller, outlining also improves performance of asm.js on non-OdinMonkey since it encourages the JIT to use the top-tier compiler.
One theoretical response to these load-time concerns is that the "use asm" directive required at the beginning of any asm.js module has no semantics and can simply be removed if AOT compilation is not beneficial. As such, "use asm" gives the developer more control over the compilation scheme used for their application. In theory (it’s difficult in practice at the moment due to lack of automated tooling), developers can exercise even finer-grain control by choosing which functions are inside the asm.js module (and thus receive AOT compilation) and which are outside (and thus receive JIT compilation). One can even imagine an Emscripten PGO pass that does this automatically for cold code.
In the end, though, it’s hard to predict what will happen in practice so we had to just try. (OdinMonkey was started as a experiment, after all.)
The results so far have been good. In addition to those reported at the beginning of the post, cold load times are also measured by the asmjs-apps-*-loadtime synthetic workloads on awfy:
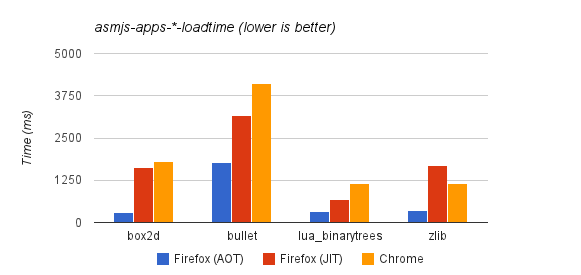
In this graph, Firefox (JIT) refers to Firefox’s performance with OdinMonkey disabled (by passing --no-asmjs to the JS shell or setting javascript.options.asmjs to false in about:config in the browser).
Another data point is the BananaBread benchmark which conveniently measures its own load time:
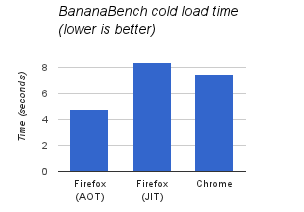
This graph reports the sum of the “preload” and “startup” times when the benchmark is run in headless mode with a cold cache.
Now let’s look at the major optimizations that AOT compilation allows.
With the intermediate JIT compilation steps avoided, the majority of AOT compilation time is in the Ion-compile step. For example, measuring the Citadel demo we can see the following breakdown of time:
Fortunately, the Ion-compile step is also the most parallelizable: each function in the asm.js module results in an independent Ion compilation and there are tens of thousands of functions in large apps. Even better, SpiderMonkey had already supported background Ion-compilation for a year before OdinMonkey, so we were able to add parallel compilation to OdinMonkey without much trouble.
After basic parallel compilation worked, we made an additional refinement to extract further parallelism. Originally, the entire asm.js module would be parsed into one big AST before being handed over to OdinMonkey. OdinMonkey would then simply recurse over the AST, firing off parallel Ion compilations as it went. This was suboptimal for two reasons:
The solution to both of these problems was to allow Odin-building and Ion-compiling to overlap parsing as illustrated in the following psuedo code:
while (not at end of asm.js module) {
  ast = ParseFunction();
  mir = CheckAndEmit(ast);
  StartBackgroundIonCompilation(mir);
  ReleaseMemory(ast)
}
Since the time to Ion-compile a function is on average longer than the time to parse, the process looks something like this:

To measure the effect, first disable caching (set javascript.options.parallel_parsing to false) and then compare compile times with and without javascript.options.ion.parallel_compilation enabled. To get a more precise measure of compile time, look at the “total compilation time ___ms” part of the “Successfully compiled asm.js code” Web Console message.
On my machine, parallel compilation reduces compile time from 11s to 5s on the Citadel demo, but this improvement is obviously contigent on the number of cores. Measuring with 2 cores, the compile time is 9s, with 3 cores, 6s, and with 4 cores, 5s. Adding further cores doesn’t appear to help. The remaining gap between this and the theoretical minimum of 3s suggested above is largely due to a fixable implementation detail.
As described above, AOT compilation occurs when "use asm" is first encountered while parsing. This can be while parsing an inline
https://blog.mozilla.org/luke/2014/01/14/asm-js-aot-compilation-and-startup-performance/
| Комментировать | « Пред. запись — К дневнику — След. запись » | Страницы: [1] [Новые] |


