����� ���� �������� �� ����� OANDA: http://fxtradeinfocenter.oanda.com/orderbook/historical_positions
��������� �������� ����� ��� “������������ ����������� �������� ������� �� FOREX”.
�� ������ �������� ������������ ������� ���� ����� ����������� � ���������. 
��� ������ �������:
You can select/unselect any of the above currency pairs. You can also click on the graph area to activate a vertical guide line.
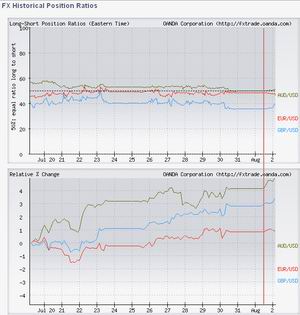
For each currency pair, the top graph shows the ratio of long positions to overall positions over time. When the ratio passes the 50% line then there are more long positions than short positions, and when the ratio falls below 50% then there are more short positions than long positions. For example, a ratio of 80% for EUR/USD means that 80% of EUR/USD positions are long and 20% are short.
The bottom graph shows price movements of a currency pair over time. The percentage of change is relative to the price at the beginning/ending of time period.
�� ������� ����� ��� �������� ���:
�� �������� �� ������ ������� ����� �� ��������� ��� ���� �������� ���. �� ����� ������ �������� �� �������, ����� ������������ ������������ �����.
��� ������ �������� ����, ������� ������ ���������� ����������� ������� ������� � �����(���������) ������� � �������� �������. ����� ����������� ���� ����� 50%, ��� ��������, ��� ����������� ������� �������, � ��������, ����� ����������� ������ ���� ����� 50%, �� ����������� �������� �������. ��������, ����������� 80% ��� EUR/USD ��������, ��� 80% ���� ������� �� EUR/USD – �������, � ������ 20% - ��������.
������ ������ ���������� �������� ��������� ��������� � �������� �������. ����� �������, ������������ ���� ���������� ������� ��������� - �� ��������� � ������ �� ������ ��� ��������� ������� �������.
� ������ ��������� ������������ �� ���� – � ��� �� ��� ��������? ������ ����� ����������� ���� ������ ���� - �������� ��������� ��������� � �������� �������. ��� ������� �� ����� �������, � ��������� ������� ��������� ���� �� 31.07.2010 ������������ 19.07.2010, ��� ��������� ��������� ������� ���� (�.�. �� ������� ����� ����� ����� 0.9%, � ������� ���� �������� ���� 19.07.2010 �� ���� ����� ��������).
�������� ������� �� ������ ��� ������� ������� ������� �� (O+C)/2. ��� ���, � ���� ���� ����� �������, �.�. �� ���� ��� �������. ���� ��� ������������ ����������� ���� ��� ������.
������ ������: http://forexpvm.at.ua/publ/forex_analitika/oanda_fxtrade_infocenter/oanda_fx_historical_position_ratios/7-1-0-14 .


