Doug Belshaw: Interim results of the Web Literacy Map 2.0 community survey |
Thanks to my colleague Adam Lofting, I’ve been able to crunch some of the numbers from the Web Literacy Map v2.0 community survey. This will remain open until the end of the month, but I thought I’d share some of the results.
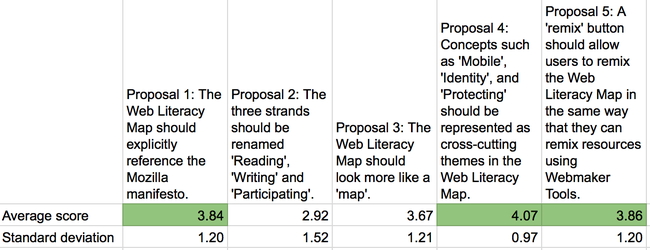
This is the high-level overview. Respondents are able to indicate the extent to which they agree or disagree with each proposal on a five-point scale. The image above shows the average score as well as the standard deviation. Basically, for the top row the higher the number the better. For the bottom row, low is good.
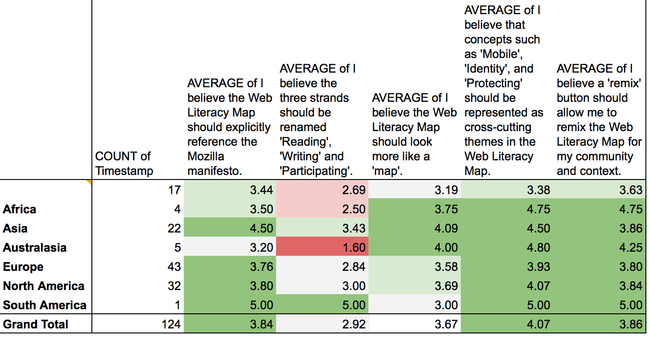
Breaking it down a bit further, there’s some interesting things you can pull out of this. Note that the top-most row represents people who completed the survey, but chose not to disclose their location. All of the questions are optional.
Things that stand out:
- There’s strong support for Proposal 4: I believe that concepts such as ‘Mobile’, 'Identity’, and 'Protecting’ should be represented as cross-cutting themes in the Web Literacy Map.
- There’s also support for Proposal 1: I believe the Web Literacy Map should explicitly reference the Mozilla manifesto and Proposal 5: I believe a 'remix’ button should allow me to remix the Web Literacy Map for my community and context.
- People aren’t so keen on Proposal 2: I believe the three strands should be renamed 'Reading’, 'Writing’ and 'Participating’. (although, interestingly, in the comments people say they like the term 'Participating’, just not 'Reading’ and 'Writing’ which many said reminded them too much of school!)
This leaves Proposal 3: I believe the Web Literacy Map should look more like a 'map’. This could have been better phrased, as the assumption in the comments seems to be that we can present it either as a grid or as a map. In fact, here’s no reason why we can’t do both. In fact, I’d like to see us produce:
- text version (like at webmaker.org/literacy)
- simple overview (as we’ve got at webmaker.org/resources)
- map version (for badged learning pathways)
Finally, a word on Proposal 5 and remixing. In the comments there’s support for this - but also a hesitation lest it 'dilutes’ the impact of the Web Literacy Map. A number of people suggested using a GitHub-like model where people can 'fork’ the map if necessary. In fact, this is already possible as v1.1 is listed as a repository under the Mozilla account.
I’m looking forward to doing some more analysis of the community survey after it closes!
Comments? Questions? Send them this way: @dajbelshaw or doug@mozillafoundation.org
| Комментировать | « Пред. запись — К дневнику — След. запись » | Страницы: [1] [Новые] |


